


Stocks VIX & SP500 Comparison of 2008 Market Top
Stock-Markets / Stock Markets 2016 Jul 11, 2016 - 10:08 AM GMTBy: Chris_Vermeulen

 Today I like to share my thoughts about the S&P 500 index, the volatility index, and what I believe will be the trigger/event which sends stock markets around the world to new multi-year lows.
While the charts shown here are very simple there is a lot of information behind the scenes that backup the analysis/predictions on the charts below.
For example, the sentiment of the average market participant remains extremely bullish on the market. The majority of investors think and feel stocks will continue to rise in the coming year. Typically, when the majority of investors think the same thing it tends to be a contrarian signal that the opposite will soon take place.
Cycle analysis is telling us that the seven-year cycle, which is one of the most powerful cycles that reoccurs in the stock market is now topping. What does this mean? It means we should expect a 1 to 3-year stock market correction.
The market breadth has been slowly deteriorating over the past year. Fewer stocks are making new highs, and many leading sectors are already in bear markets.
So it is just a matter of time before the US large-cap stocks roll over, breakdown, and start a new bear market.
As of Friday, July 9 we’ve seen the stock market momentum show signs of a short squeeze, and also that the majority of market participants are in a panic running to buy stocks. In fact, the NYSE volume ratio shows that there are 18 shares being purchased to every 1 being sold on Friday. I consider a ratio over three to be an extreme level, meaning 18 is signaling a potential significant turning point in stocks in the coming week.
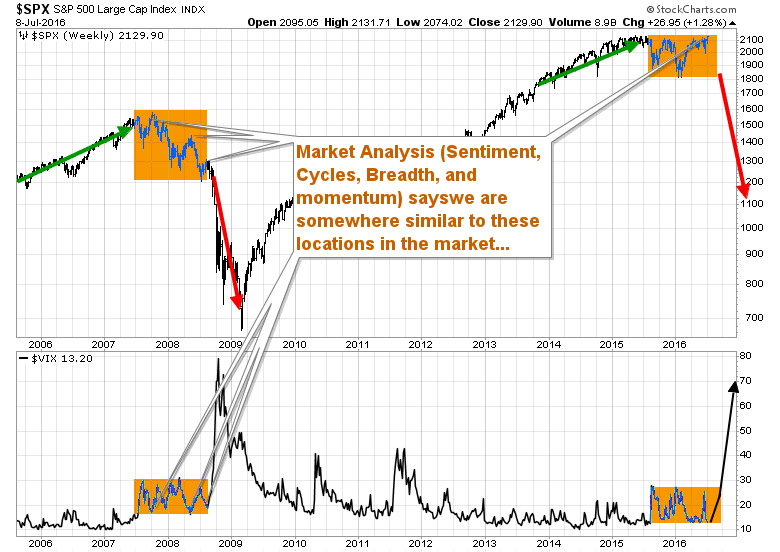
SP500 & VIX Weekly Comparison Chart
If you take a look at the chart below you can see where I feel the stock market is currently trading in terms of its 2007 to 2008 market top. The volatility index is also showing similar patterns to what we saw before the 2008 bear market.
Based on the current price action of the S&P 500 index and the volatility index it appears that a sharp decline in shares is likely to unfold in the coming weeks.
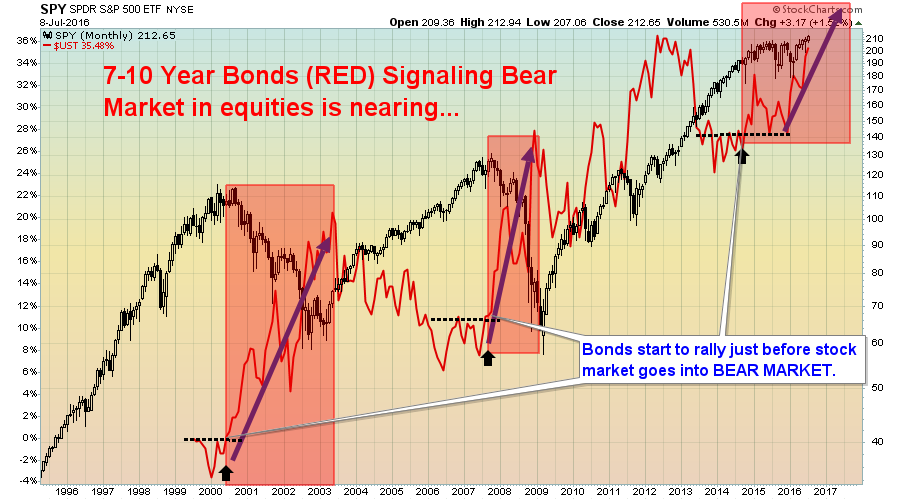
SP500 & Bond Price Comparison – Bonds rally before/lead Bear Markets
Take a look at the chart below. The red line is the price of US bonds. The black candlestick chart is the S&P 500 index which is the US large-cap stocks. As you can see the price of bonds start to rally way before the US stock market rolls over and sells off.
Why does this happen? I believe that the smart money is rotating their money slowly out of equities and into bonds in anticipation of the bear market collapse. Bonds act as a safe haven during times of weakness in both the economy and stock market.
US equities still have a long way to fall before they are technically in a confirmed bear market. The recent rally in bonds is just the beginning for what is to happen.
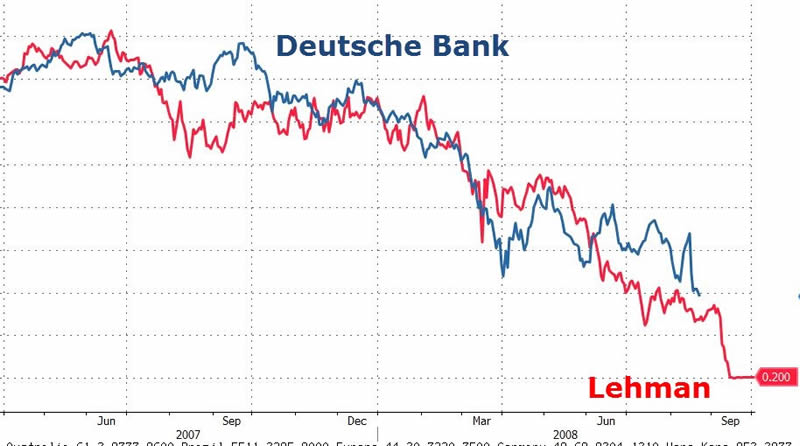
The Trigger/Event/Tipping Point for A Global Equities Crash
In a recent article called “Deutsche Bank to initiate the next financial crisis”, I wrote about how Deutsche Bank is going down the exact same road as Lehman Brothers. In short, both stocks are declining in a similar fashion in terms of share price.
But here is the kicker… If you thought Lehman Brothers was bad you haven’t seen anything yet. The big differences this time around with the banking crisis is that this is 40 times larger than Lehman Brothers and will directly affect almost all key countries and banks around the world. And this time, countries are in far worse shape financially than they were in 2008 during the Lehman Brothers bankruptcy.
My Concluding Thoughts:
In short, the US stock market is trying to hold up and convince investors everything is fine. While stocks are testing all-time highs I know as a technical analyst that the market is much weaker than it appears.
A lot of things are coming together to form a major market top but like all previous stock market tops, they require a lot of time to mature before they breakdown and new nominal highs are normal to see.
So, if you want to stay ahead of the curve and avoid the next stock market crash and profit from it follow me at www.TheGoldAndOilGuy.com to receive my daily analysis, swing trades and long term ETF investing signals.
Chris Vermeulen
Join my email list FREE and get my next article which I will show you about a major opportunity in bonds and a rate spike – www.GoldAndOilGuy.com
Chris Vermeulen is Founder of the popular trading site TheGoldAndOilGuy.com. There he shares his highly successful, low-risk trading method. For 7 years Chris has been a leader in teaching others to skillfully trade in gold, oil, and silver in both bull and bear markets. Subscribers to his service depend on Chris' uniquely consistent investment opportunities that carry exceptionally low risk and high return.
Disclaimer: Nothing in this report should be construed as a solicitation to buy or sell any securities mentioned. Technical Traders Ltd., its owners and the author of this report are not registered broker-dealers or financial advisors. Before investing in any securities, you should consult with your financial advisor and a registered broker-dealer. Never make an investment based solely on what you read in an online or printed report, including this report, especially if the investment involves a small, thinly-traded company that isn’t well known. Technical Traders Ltd. and the author of this report has been paid by Cardiff Energy Corp. In addition, the author owns shares of Cardiff Energy Corp. and would also benefit from volume and price appreciation of its stock. The information provided here within should not be construed as a financial analysis but rather as an advertisement. The author’s views and opinions regarding the companies featured in reports are his own views and are based on information that he has researched independently and has received, which the author assumes to be reliable. Technical Traders Ltd. and the author of this report do not guarantee the accuracy, completeness, or usefulness of any content of this report, nor its fitness for any particular purpose. Lastly, the author does not guarantee that any of the companies mentioned in the reports will perform as expected, and any comparisons made to other companies may not be valid or come into effect.
Chris Vermeulen Archive |
© 2005-2022 http://www.MarketOracle.co.uk - The Market Oracle is a FREE Daily Financial Markets Analysis & Forecasting online publication.