


Forex Trading EUR, GBP, USD/JPY - Double Bottom or New Lows?
Currencies / Forex Trading Jul 08, 2016 - 10:25 AM GMTBy: Nadia_Simmons

 In recent days, the yen moved higher against the greenback as safe-haven buying supported the Japanese currency. In this environment, USD/JPY declined to important support and approached the Jun low. Double bottom or new lows?
In our opinion, the following forex trading positions are justified – summary:
EUR/USD: short (a stop-loss at 1.1236; initial downside target at 1.0708)
GBP/USD: short (a stop-loss at 1.3579; initial downside target at 1.2519)
USD/JPY: none
USD/CAD: none
USD/CHF: none
AUD/USD: none
EUR/USD
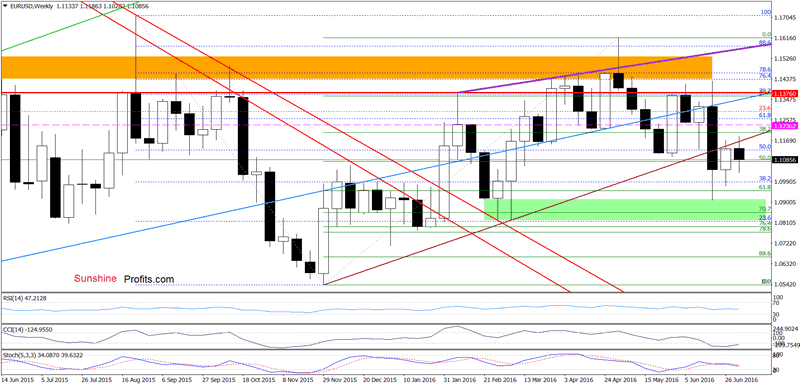
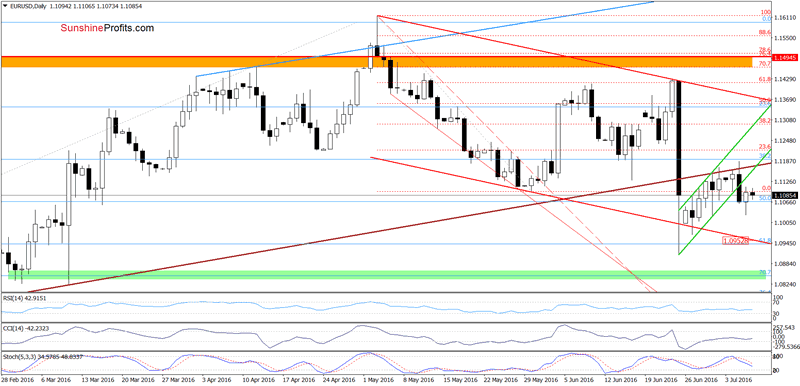
Looking at the daily chart, we see that although EUR/USD moved higher yesterday, the pair closed yesterday’s session under the previously-broken lower border of the green rising trend channel, which looks like a verification of earlier breakdown. If this is the case and the exchange rate extends declines, the initial downside target would be around 1.0953, where the lower border of the red declining trend channel currently is.
Additionally, the risk of a bearish flag formation remains in play, which means that what we wrote yesterday is up-to-date:
(…) the risk of a bearish flag formation increased significantly after the exchange rate verified the breakdown under the long-term brown line and the Stochastic Oscillator generated a sell signal. Taking these facts into account, (…) we may see not only test of the recent low and the 61.8% Fibonacci retracement, but also decline even to around 1.0670, where the size of the move will correspond to the length of the first downward move (please note that slightly below this level (at 1.0660) is also the 88.6% Fibonacci retracement based on the entire Dec-May upward move, which serves as an additional support that may pause declines).
Very short-term outlook: bearish
Short-term outlook: bearish
MT outlook: mixed with bearish bias
LT outlook: mixed
Trading position (short-term; our opinion): Short positions with a stop-loss order at 1.1236 and initial downside target at 1.0708 are justified from the risk/reward perspective.
GBP/USD
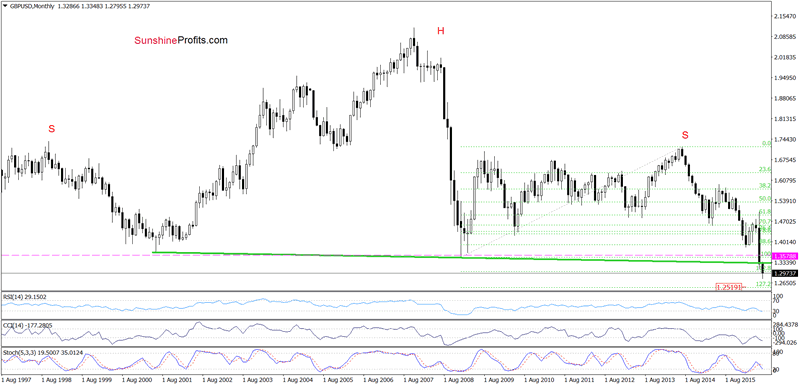
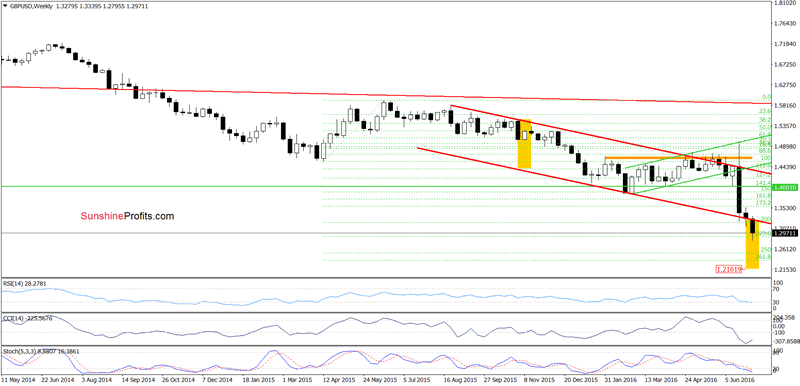
On the above charts, we see that GBP/USD is still trading under the neck line of the head and shoulders formation and the lower border of the red declining trend channel, which means that what we wrote in our previous commentary on this currency pair is up-to date also today:
(…) GBP/USD dropped under the lower border of the red declining trend channel and hit a fresh multi-year low. This is a strong bearish signal, which suggests further deterioration and a drop even to around 1.2161, where the size of the downward move will correspond to the height of the formation.
Very short-term outlook: bearish
Short-term outlook: bearish
MT outlook: bearish
LT outlook: bearish
Trading position (short-term; our opinion): Short positions with a stop-loss at 1.3579 and the initial downside target at 1.2519 are justified from the risk/reward perspective at the moment.
USD/JPY
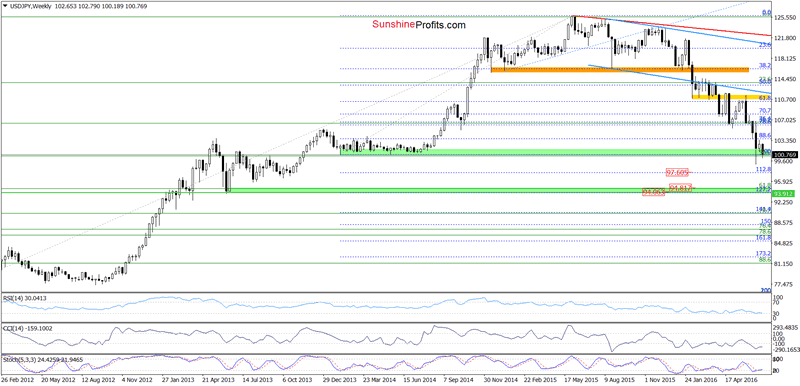
Quoting our Forex Trading Alert posted on Jun 24:
The first thing that catches the eye on the above charts is breakdown under the green support zone (…) around 100.74-102 (…). Despite this drop, currency bulls came back to the market, which resulted in invalidation of earlier breakdown. Although this is a positive signal, which suggests further improvement, we think that (…) high volatility may result in a re-test of the green zone and the Feb 2014 lows.
From today’s point of view, we see that the situation developed in line with the above scenario and USD/JPY reversed and declined once again. With this week’s move, the pair reached the green zone, which will likely result in a re-test of the green zone and the Feb 2014 low. However, if this support level is broken, we may see further deterioration and a drop to the 112.8% Fibonacci extension (around 97.60) or even to the next green support zone (created by the 127.2% Fibonacci extension, the 61.8% retracement based on the entire 2011-2015 upward move and the Jun 2013 lows) around 94.06-94.81 in the coming days.
Very short-term outlook: mixed with bearish bias
Short-term outlook: mixed with bearish bias
MT outlook: mixed
LT outlook: mixed
Thank you.
Nadia Simmons
Forex & Oil Trading Strategist
Przemyslaw Radomski
Founder, Editor-in-chief
Sunshine Profits: Gold & Silver, Forex, Bitcoin, Crude Oil & Stocks
Stay updated: sign up for our free mailing list today
* * * * *
Disclaimer
All essays, research and information found above represent analyses and opinions of Nadia Simmons and Sunshine Profits' associates only. As such, it may prove wrong and be a subject to change without notice. Opinions and analyses were based on data available to authors of respective essays at the time of writing. Although the information provided above is based on careful research and sources that are believed to be accurate, Nadia Simmons and his associates do not guarantee the accuracy or thoroughness of the data or information reported. The opinions published above are neither an offer nor a recommendation to purchase or sell any securities. Nadia Simmons is not a Registered Securities Advisor. By reading Nadia Simmons’ reports you fully agree that he will not be held responsible or liable for any decisions you make regarding any information provided in these reports. Investing, trading and speculation in any financial markets may involve high risk of loss. Nadia Simmons, Sunshine Profits' employees and affiliates as well as members of their families may have a short or long position in any securities, including those mentioned in any of the reports or essays, and may make additional purchases and/or sales of those securities without notice.
© 2005-2022 http://www.MarketOracle.co.uk - The Market Oracle is a FREE Daily Financial Markets Analysis & Forecasting online publication.