


Stocks Bear Market Resumes or Just More Noise
Stock-Markets / Stock Markets 2016 Jun 26, 2016 - 02:19 PM GMTBy: Tony_Caldaro

 The market started this volatile week at SPX 2071. After a gap up opening on Monday to SPX 2101 the market pulled back until Wednesday when it hit SPX 2084. Another gap up opening on Thursday carried the market to SPX 2113. Then Brexit was confirmed and markets worldwide plunged on Friday. For the week the SPX/DOW were -1.6%, and the NDX/NAZ were -2.0%. Economic reports were biased negative for the first time in quite a while. On the downtick: new home sales, durable goods, consumer sentiment and the Q2 GDP estimate. On the uptick: FHFA housing, existing home sales and weekly jobless claims declined. Next week’s reports will be highlighted by Q1 GDP, PCE prices and the Chicago PMI.
LONG TERM: neutral
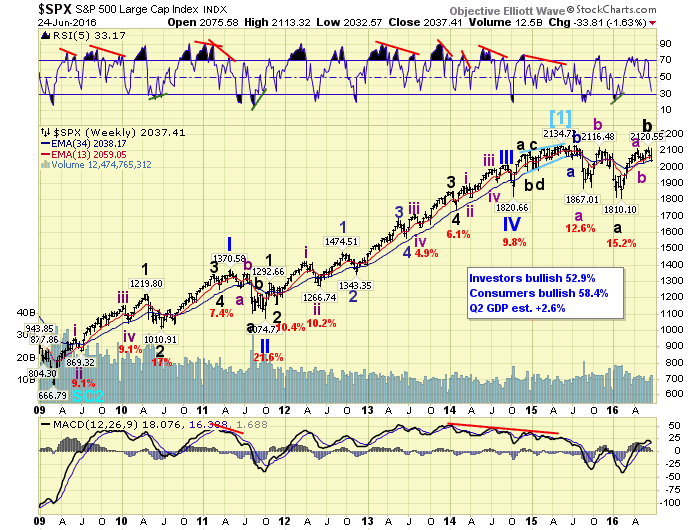
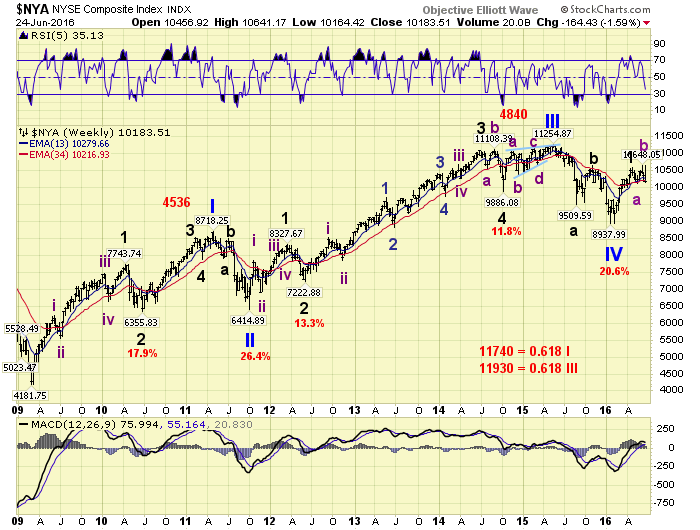
For the past month or so we have been discussing the ongoing bifurcation between the futures driven SPX and the cash driven NYSE. Our OEW model suggests the SPX ended its bull market in 2015 and a bear market has been underway ever since.
The NYSE, however, suggests the bull market only completed four Primary waves, and Primary wave V is currently underway. Since some in our group consider both counts as valid, and future market action could fit both scenarios structurally, we have taken a neutral stance long term.
Despite which count wins out in the end, this has been one volatile market for investors. Since the 2015 all time high the SPX has dropped 268 points, rallied 249 points, dropped 306 points, rallied 311 points, and is now heading down again. As of Friday’s close it is down about 5% from the high.
MEDIUM TERM: downtrend
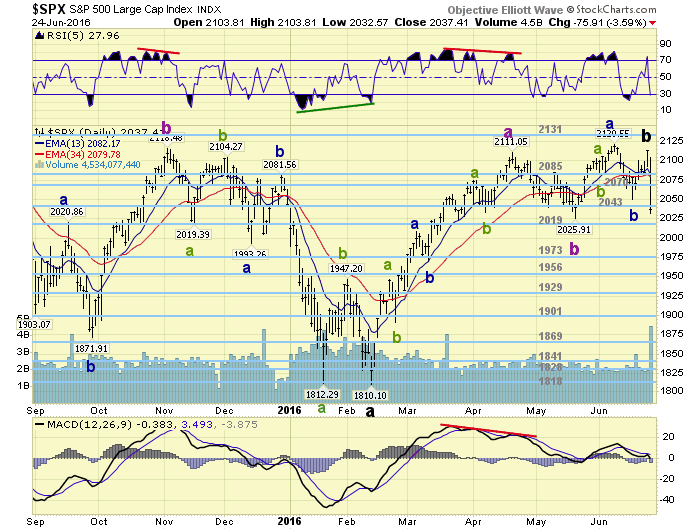
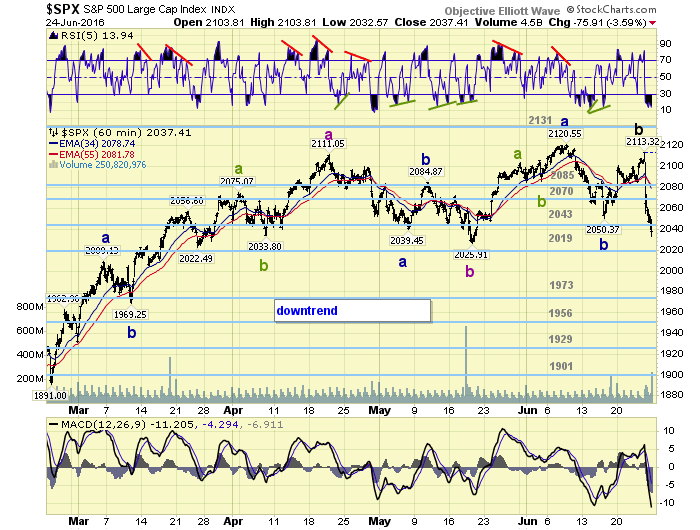
After coming within 8 points of the uptrend high at SPX 2121, the market reversed hard to the downside on Friday and confirmed a new downtrend. The inflection point, noted last week, has already been resolved without having to drop below SPX 2026. We now have three waves up from the SPX 1810 low. This naturally suggests the entire advance from that low to SPX 2121 has been corrective, and we have labeled it Major wave B. Corrective advances like this are typical bear market activity.
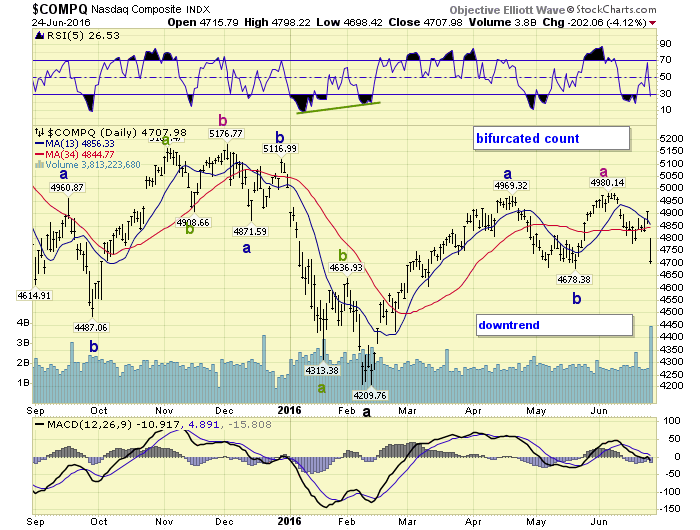
However, since we are dealing with a bifurcated market the three wave advance from SPX 1810 may only be Intermediate A of Major B, and the current downtrend only Intermediate wave B. This wave structure would allow for new highs during an irregular B wave, even though this is technically a bear market. For those interested, we are carrying this count on the NAZ daily chart.
Medium term support is at the 2019 and 1973 pivots, with resistance at the 2043 and 2070 pivots.
SHORT TERM
From the recent downtrend low at SPX 2026 the market rallied to SPX 2121, declined to 2050, then rallied on Thursday to 2113. This appears to be a failed inverted flat, as the last rally was five waves. Overnight the futures traded high enough for a SPX 2128 print, but the cash market never saw those levels since it opened on a gap down at SPX 2064.
Under the Major wave B scenario at SPX 2121/2113 the market should now be heading lower in a Major wave C. It could subdivide into three Intermediate waves (trends), like Major wave A, so no guarantee we are headed to new lows during this downtrend.
Under the bifurcated scenario this downtrend should only do a retracement of the entire advance from SPX 1810-2121. This would suggest two potential areas: the 1973 pivot range (50%) and the 1929 pivot range (61.8%). Short term support is at the 2019 and 1973 pivots, with resistance at the 2043 and 2070 pivots. Short term momentum ended the week quite oversold.
FOREIGN MARKETS
The Asian markets were mostly lower for a net loss of 1.2%.
The European markets were also mostly lower for a net loss of 3.3%.
The Commodity equity group were mixed for a net gain of 0.4%.
The DJ World index lost 1.7%.
COMMODITIES
Bonds continued their uptrend gaining 0.2%.
Crude may be in a downtrend and lost 2.6%.
Gold is in an uptrend and gained 1.3%.
The USD is in an uptrend and gained 1.3%.
NEXT WEEK
Tuesday: Q1 GDP, Case-Shiller, Consumer confidence, and a speech from FED governor Powell. Wednesday: Personal income/spending, Pending home sales, the PCE, and a speech from FED chair Yellen. Thursday: weekly Jobless claims and the Chicago PMI. Friday: ISM manufacturing, Construction spending and Auto sales. Best to your weekend and week!
CHARTS: http://stockcharts.com/public/1269446/tenpp
After about 40 years of investing in the markets one learns that the markets are constantly changing, not only in price, but in what drives the markets. In the 1960s, the Nifty Fifty were the leaders of the stock market. In the 1970s, stock selection using Technical Analysis was important, as the market stayed with a trading range for the entire decade. In the 1980s, the market finally broke out of it doldrums, as the DOW broke through 1100 in 1982, and launched the greatest bull market on record.
Sharing is an important aspect of a life. Over 100 people have joined our group, from all walks of life, covering twenty three countries across the globe. It's been the most fun I have ever had in the market. Sharing uncommon knowledge, with investors. In hope of aiding them in finding their financial independence.
Copyright © 2016 Tony Caldaro - All Rights Reserved Disclaimer: The above is a matter of opinion provided for general information purposes only and is not intended as investment advice. Information and analysis above are derived from sources and utilising methods believed to be reliable, but we cannot accept responsibility for any losses you may incur as a result of this analysis. Individuals should consult with their personal financial advisors.
Tony Caldaro Archive |
© 2005-2022 http://www.MarketOracle.co.uk - The Market Oracle is a FREE Daily Financial Markets Analysis & Forecasting online publication.