Increase In U.S. Rig Count Will Not Cap Oil Prices
Commodities / Crude Oil Jun 22, 2016 - 10:28 AM GMTBy: OilPrice_Com

 The impact of rising oil prices on North American light tight oil (LTO) production is said to be a “Catch 22”, the title of Joseph Heller’s popular 1961 novel set in WWII. The premise was you could get out of the army if you were crazy but you weren’t crazy to try to get out of the army. So this avenue to escape the war didn’t work for the book’s main character John Yossarian.
Too many analysts continue to believe drilling and service has the same problem with rising oil prices. With WTI back above $50 a barrel – at least briefly last week – North American LTO developers are putting rigs, service equipment and personnel back to work. The so-called “fraclog” or “DUC” inventory (wells drilled but uncompleted) is being reduced. While this is good it is also thought by some to be temporary.
Those who study crude prices have correctly observed it was the 4 million barrels per day (b/d) increase in U.S. LTO production that contributed greatly to the 2014 oil price collapse. So if the price of oil is now high enough to make LTO economic again some believe the reward will either be a cap on further price increases or the foundation of the next collapse. The Catch 22 is if oil prices rise high enough to put drilling and service back to work then it won’t last long.
Maybe.
To this writer the most meaningless indicator of the future of world oil prices has been the weekly U.S. oil rig count published by Baker Hughes and opined upon regularly by oil analysts and writers since late 2014. That’s when it became an important world oil price driver for the first time. The argument emerged that having contributed to the collapse of world oil prices, U.S. LTO was the new global “swing producer”, replacing OPEC leader Saudi Arabia in that role. If and when prices rose the U.S. rig count would rise and ultimately cause prices to fall again. If prices went too low the LTO operators couldn’t afford to drill, which would shrink supply and cause prices to rise.
This is materially different than prolific oil producer Saudi Arabia, which established its swing producer credentials over several decades merely by opening and closing valves. The geological and commercial differences between the two couldn’t be more glaring. In the Middle East a single state oil company is exploiting arguably the most prolific reservoirs in the world. A state-controlled entity can do whatever it wants including shutting in production to manipulate prices without fear of prosecution.
In the U.S. hundreds of operators run thousands of rigs to exploit arguably some of the most expensive and geologically complex reservoirs in the world. If they somehow collude to restrict supply to affect prices they will be prosecuted and perhaps sent to jail. Whoever came up with this idea really should do more homework.
Nevertheless, the comparison got legs and away it went. With world oil prices being a huge business story analysts started to focus their attention on the weekly U.S. oil rig count as a precursor of when U.S. LTO would fall. Every Friday the Baker Hughes rig count would wiggle. If it went down WTI might tick up. If it went up WTI might tick down. WTI is the most heavily traded and speculative commodity in the world some days trading 1,000 times as many “dry” barrels (futures contracts) as “wet” barrels (actual oil production priced off WTI).
Besides massive futures trading, the other factors affecting WTI include the value of the U.S. dollar (it rises and WTI falls), OPEC production, world oil demand, North American and U.S. storage, Iranian crude embargoes, and periodic and unplanned supply disruptions from everywhere from Libya to Nigeria to Fort McMurray.
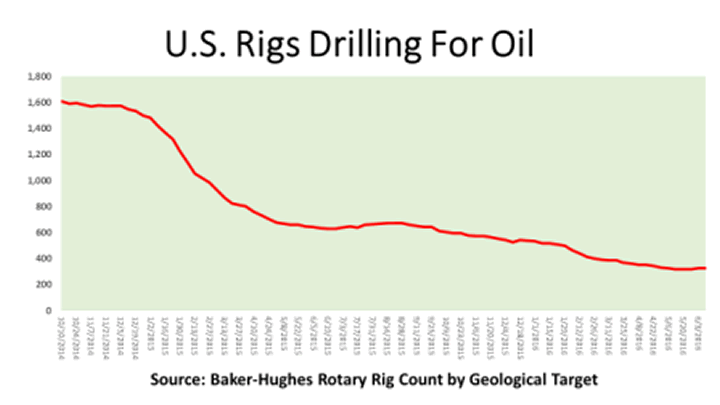
Regardless, the U.S. oil rig count regularly makes the news and affects the price of WTI. The following chart shows the figures for the past 19 months since it peaked in October of 2014 at 1,609 and hit the lowest level in years at only 316 in late May, merely 20 percent of the high water number.

IMG URL: http://cdn.oilprice.com/images/tinymce/2016/Yag1sss.png
The collapse of the American rig count and subsequent decline in LTO output has indeed contributed mightily to rebalancing world oil markets. According to the Energy Information Administration (EIA) U.S. oil production is down nearly 1 million b/d in the past year. The EIA reported June 14 that it expects LTO output to fall by another 118,000 b/d by July, mostly from the Bakken and Eagle Ford.
Assisted by this and other factors, WTI has been one of the top performing commodities since it closed at the lowest price in over a decade at only $26.19 on February 11. It has risen almost steadily to reach the highest price since last July on June 8 when it closed at $51.23, a whopping 96 percent increase. In the past week two things have occurred: WTI has lost about $3 a barrel and on June 10 the U.S. oil-targeted rig count had risen by 12 to 328.
This modest uptick in the rig count once again caused concern and prognostication on the future of oil prices. In a Globe and Mail story June 10 a New York oil trader told Reuters news agency, “This looks like the beginning of a trend that will translate into the slowing down of U.S. production declines. I’m adding to my short position in spreads”.
This view was supported by the news June 9 reporting LTO pioneer Continental Resources Inc. was picking up service rigs and frac crews to reduce its fraclog in the Bakken. Reports say the U.S. exited 2015 with 4,290 DUC wells waiting for completion which, in most cases, costs more than drilling. That said, Continental CEO Harold Hamm said his company had no intention of resuming drilling until WTI reached $60. He was also optimistic WTI could exit 2016 at $70 because of the rapid rebalancing of global crude supply and demand.
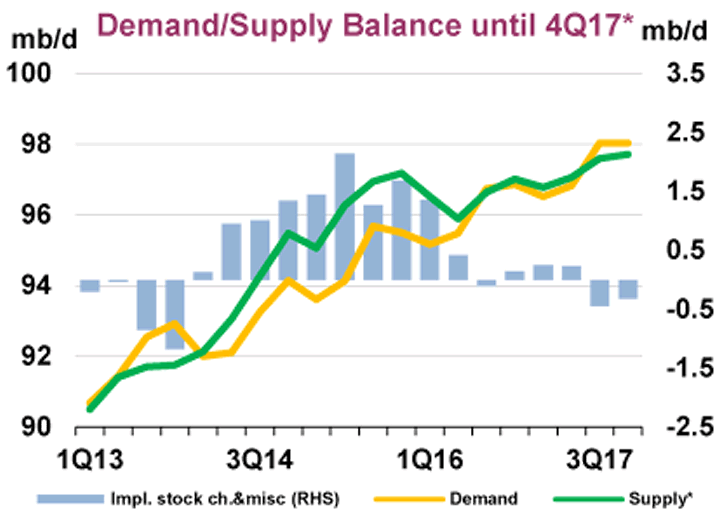
On Wednesday July 15 Goldman Sachs resumed its pessimistic outlook with a research report stating, “On an aggregate, we view the price recovery as fragile”. The latest bearish outlook from Goldman is remarkable considering the June 13 monthly world crude oil markets report from the International Energy Agency (IEA). It contained the outlook for the remainder of 2016, and the IEA’s first stab at 2017 which is in the following chart.

IMG URL: http://cdn.oilprice.com/images/tinymce/2016/Yag2.png
From this data it is impossible to be anything but optimistic about future oil prices. The two-year massive oversupply of production versus demand (the green line over the yellow line, the blue bars above zero) from the third quarter of 2014 through to the second quarter of 2016 – sometimes as much as 2.4 million b/d – is all but gone by Q3 2016. Because of massive reductions in capital spending all over the world (Wood Mackenzie currently estimates the aggregate value of cancelled oil development projects to be over $1 trillion) and the natural decline of all reservoirs, falling supply and rising demand for the next 18 months will create the best conditions for higher prices since 2013 and early 2014. Then WTI at or near $100 a barrel was common.
The IEA also admits it has underestimated demand growth. It forecast a consumption increase of 1.2 million b/d in 2016 but reported an actual increase of 1.6 million b/d in Q1 2016. Regardless, the IEA has only increased estimated demand growth for 2016 by 100,000 b/d - 8 percent - despite being low by 33 percent in Q1. Higher than expected oil consumption could accelerate price increases. Some analysts have consistently noted IEA demand estimates are usually excessively conservative.
The IEA cautions the return of Canada’s oil sands to the market or the potential outbreak of peace and tranquility in Nigeria, Libya and Venezuela could change this outlook. Okay. Every forecast must carry these caveats. But the tall foreheads in Paris who study global oil markets do not believe U.S. LTO production will recover materially or that Iran’s current and planned production increases will actually affect world crude markets. OPEC is at or near peak output. Middle East OPEC members are having to add more drilling rigs just to sustain output let alone increase it.
The IEA estimates world oil demand will be nearly 97 million b/d by Q4 2016 but some analysts still figure that 12, 20 or even 100 more rigs drilling LTO in the U.S. is going to cap the world oil price. Rubbish. The U.S. oil rig count would have to double to actually move the needle in the face of continuous LTO reservoir decline rates exceeding 100,000 b/d per month.
The problem is the massive machine that put 4 million b/d of U.S. LTO on stream from 2010 to 2014 no longer exists. It was fueled by $100 oil, hundreds of operators of varying sizes, red hot equity markets, open and reckless debt markets, and nearly 1,500 drilling rigs operating every day supported by an over-levered fracking and oil service infrastructure now on its knees if still in business.
To grow production at this rate the cash to pay for drilling, completions and tie-ins was plentiful and came from a variety of sources. While oil prices may be rising there’s just no cash. Many LTO developers have gone bankrupt and many more are up against their credit facilities. Junk bond buyers are more concerned with getting their money back from past investments than writing cheques. When cash flow increases with oil prices in many cases the first call will be by lenders. Squeezed drilling and service operators are in no position to extend credit to struggling operators.
It will take some time to completely refuel the LTO development machine. Those who figure U.S. LTO output will track WTI in a straight line clearly don’t understand the complexities of how this large and complex business, fueled extensively by external capital, actually works.
So drilling and service can relax. With the exception of oil sands, the North American upstream oil and gas sector is more likely to be in the early stages of a long-term recovery than experiencing a short-term blip.
Link to original article: http://oilprice.com/Energy/Energy-General/Increase-In-US-Rig-Count-Will-Not-Cap-Oil-Prices.html
By David Yager for Oilprice.com
© 2016 Copyright OilPrice.com - All Rights Reserved
Disclaimer: The above is a matter of opinion provided for general information purposes only and is not intended as investment advice. Information and analysis above are derived from sources and utilising methods believed to be reliable, but we cannot accept responsibility for any losses you may incur as a result of this analysis. Individuals should consult with their personal financial advisors.
OilPrice.com Archive |
© 2005-2022 http://www.MarketOracle.co.uk - The Market Oracle is a FREE Daily Financial Markets Analysis & Forecasting online publication.


