


Will Gold’s Bullish Price Chart Outperform Gold’s 5 Bearish Indicators?
Commodities / Gold and Silver Stocks 2016 Jun 20, 2016 - 04:31 AM GMTBy: InvestingHaven

 We are very closely watching the trend in the gold market, and we know that readers are doing the same based on the many thousands of views on our latest gold articles.
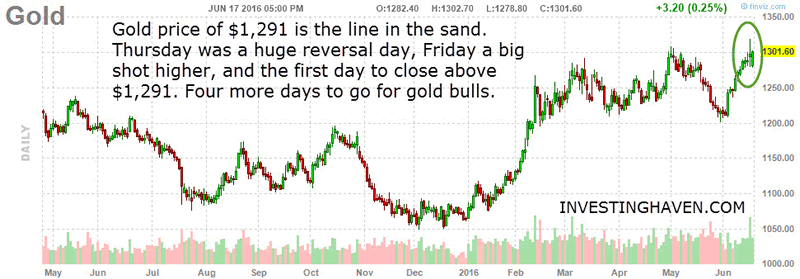
Earlier this week, we wrote that $1,291 is an extremely important gold price, and that at least 5 consecutive closes above that price would suggest the bull market in gold has returned. We explained why $1,291 is such an important gold price, and why June 2016 is an incredibly important month. Please re-read Gold bull or bear market: Why June 2016 is the most important month of the decade for gold.
We deep dived into our gold indicators, and basically found out that all our indicators are flashing red. That is very odd, and certainly not in line with Friday’s bullish gold price action. Our gold indicators are definitely not in line with what Bloomberg is suggesting.
On Friday, gold performed extremely well, as it managed to close above $1,291 on strong volume. That’s the first day with a close above $1,291, so at least four more closes above that price level are required for a strong sign that gold has entered a new bull market.
From a chart perspective, gold looks bullish, but that as it is not in line with the leading precious metals indicators in our methodology. Our indicators look (very) bearish. In all honesty, we are also surprised about this strong divergence.
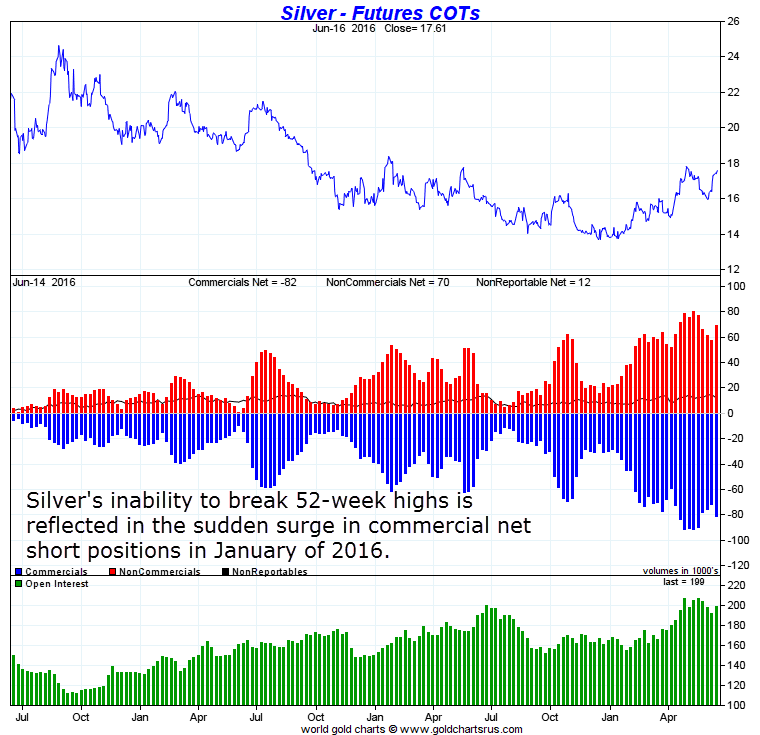
The two indicators that we consider most concerning are the Commitment of Traders (COT) data for both gold and silver. We have explained many times how we interpret the COT data: the faster the net short positions of commercials (hedgers) grow, to an extreme level, the more bearish the outlook for prices. Both gold and silver sax an extremely fast run up between January and March of 2016. That is very bearish. Chart courtesy: Sharelynx.
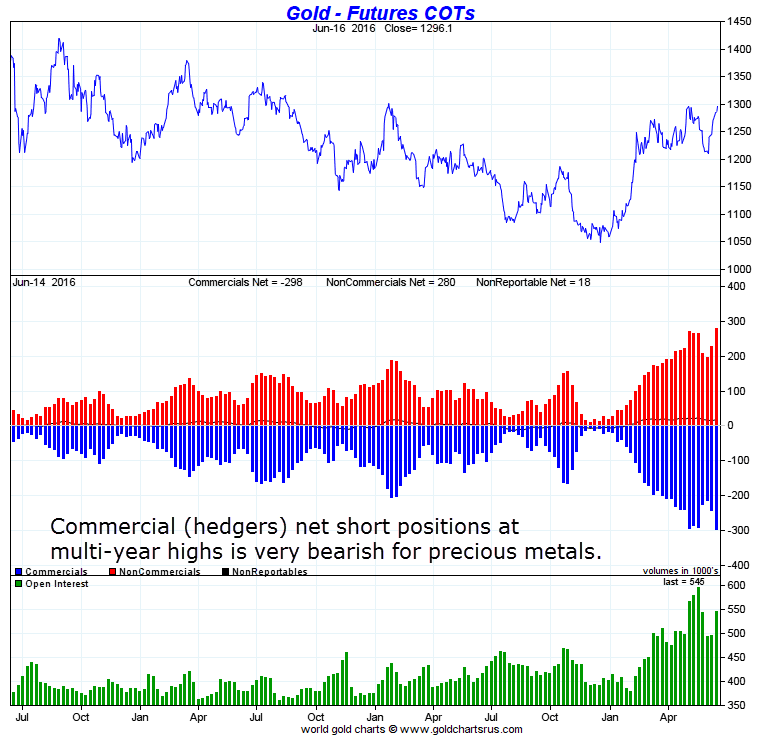
Please take into account that the COT report is not a timing indicator. COT data have to be read against price action and other gold indicators. In other words, if the COT report is very bearish right at strong overhead resistance on a chart, it suggests that there is not much power for a rally to continue.
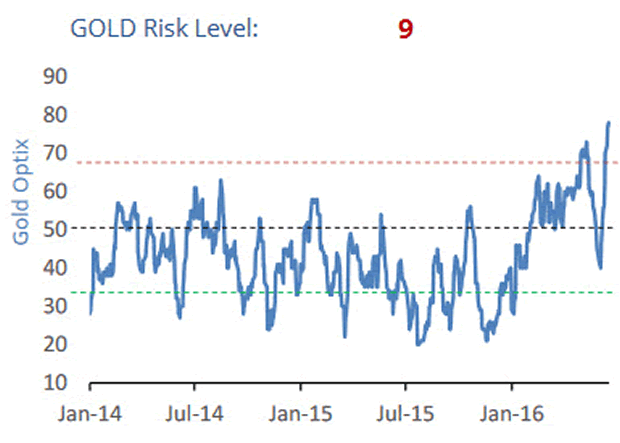
Our third indicator with an extremely bearish reading is gold sentiment. According to Sentimentrader, gold’s optimism index got ahead of itself. The index has moved above 75 for the first time since 2011, a troubling level. That’s especially true since “smart money” commercial hedgers have moved to a near-record net short position against the metal.
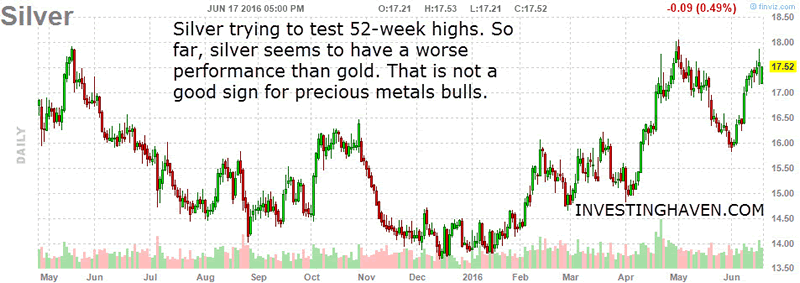
Our fourth indicator is the price of silver. In a raging bull market, silver tends to lead gold and miners higher. The concerning fact for gold bulls is that silver has been lagging significantly. Gold is trading above its 52-week highs, but silver has not been able to do so.
The last indicator is the U.S. dollar. According to Sentimentrader, hedgers have been reducing their shorts against the U.S. dollar over the past year, and they are getting close to being net long. While not foolproof, the dollar has tended to do well in recent years when hedgers were long (that would be another headwind for gold).
CONCLUSION:
Gold’s price action and gold’s chart have a bullish look. Friday’s close was definitely strong. However, our leading indicators for the precious metals complex are very bearish. There is a strong divergence between gold price and gold indicators. We prefer to let the market do its work. Meantime, we remain open to every outcome.
Analyst Team
The team has +15 years of experience in global markets. Their methodology is unique and effective, yet easy to understand; it is based on chart analysis combined with intermarket / fundamental / sentiment analysis. The work of the team appeared on major financial outlets like FinancialSense, SeekingAlpha, MarketWatch, ...
Copyright © 2016 Investing Haven - All Rights Reserved Disclaimer: The above is a matter of opinion provided for general information purposes only and is not intended as investment advice. Information and analysis above are derived from sources and utilising methods believed to be reliable, but we cannot accept responsibility for any losses you may incur as a result of this analysis. Individuals should consult with their personal financial advisors.
© 2005-2022 http://www.MarketOracle.co.uk - The Market Oracle is a FREE Daily Financial Markets Analysis & Forecasting online publication.