


Trading Markets - When Is A Candle Not A Candle?
InvestorEducation / Learn to Trade Jun 19, 2016 - 11:07 AM GMTBy: Chris_Drinkwater

 When it's a bar? When it's a line drawing? Mountain? A candle is never a candle, it is a representation of a group of people buying and selling. Further to that, you could say it is a representation of thousands of people's hopes and dreams as they try to make this thing called trading work for them.
It seems so obvious when you write it down like this but I don't think the average trader gives it a moment's thought. A candle to them is one in a series that makes a pattern that will ultimately lead them to a buying or selling decision. Ignore the truth of what the candle represents at your peril.
Behind the Candle
I am always very keen to look behind the candle to see who's there. Is it a bank or other Institution, savvy private investor , or inexperienced traders?
Why do I bother with these thoughts? Because in my experience it is difficult to beat the banks and the smart money but it is quite easy to beat the inexperienced trader.
A Contrarian Approach
It is an unpalatable fact that for every winner there must be a loser, the so called zero sum game. As I would rather be on the winning team, that means taking a somewhat contrarian approach to trading.
Most of my buying opportunities are afforded by the novice trader's selling signals and my selling trades are based on their buying patterns. To get this right means taking a peek behind the candle to try to determine the novice from the expert and it's not as easy as you think.
In our course we teach a specific trade to take advantage of these traders, at first glance it seems a simple strategy but it requires patience and discipline to become regularly successful. To give you some idea let's take look at the following two charts.
Fig 1
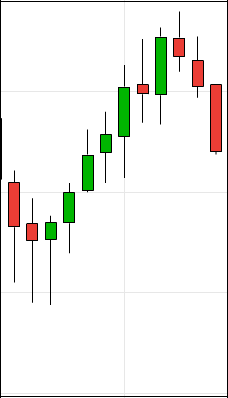
Fig 2
![]()
What do these charts have in common? Can you determine more information from Fig1 than Fig 2?
They are both exactly the same price action! Fig 1 is a 10 minute chart and Fig 2 is a one hour chart. After all my time in trading I am still surprised by the reluctance of many traders to analyse more than one time frame.
This is one way we can easily get an edge over such traders who are making decisions based on only a 5 or 10 minute chart. With so many more candles printed, it is easy to come to a decision to buy or sell when a higher time frame is contradicting this.
My Trading Toolbox
My trading toolbox is empty of all indicators that are so much beloved by the newbie trader. No adx for me, I live without macd and rsi and get along just fine without the aid of Ichimoku clouds. All that remains are measuring tools like moving averages, trend lines, Fibonacci lines and my trusty calculator.
War
Trading is a war. You must become a predator of weaker prey and be ruthless in your hunt and the kill. We are daily teaching weak prey to become the Lion and I am comfortable with that, I don't mind the competition, and the jungle is full of quarry.
Chris Drinkwater
www.Animusfx.com
I am a successful Day / Swing Trader and Partner in a local business in the South West of the UK.
I have been trading now for 10 years and in that time have accumulated a huge amount of screen time and experience, with many thousands of trades taken in that time.
I am acutely aware how difficult it is for anyone starting out in this trading business and how much information in the public domain is inaccurate, out of date or just plain wrong.
We started our website with the intention of educating newcomers and giving them the tools they need to increase their confidence, consistency and discipline in trading.
We now have over 250 students in 49 countries across the world and we are growing fast!
© 2016 Chris Drinkwater - All Rights Reserved
Disclaimer: The above is a matter of opinion provided for general information purposes only and is not intended as investment advice. Information and analysis above are derived from sources and utilising methods believed to be reliable, but we cannot accept responsibility for any losses you may incur as a result of this analysis. Individuals should consult with their personal financial advisors.
© 2005-2022 http://www.MarketOracle.co.uk - The Market Oracle is a FREE Daily Financial Markets Analysis & Forecasting online publication.