


How to Use the Gold-to-Silver Ratio?
Commodities / Gold and Silver 2016 Jun 17, 2016 - 05:33 PM GMTBy: Arkadiusz_Sieron

 We have debunked the myth that gold-to-silver ratio should revert to its “true” level around 16. The predominant range for the ratio in modern times is rather well between 40 and 80. Moreover, the notion that the gold-to-silver ratio should revert to some historical average makes no sense. The relative valuation between these two precious metals depends on market forces, like the health of the world economy and monetary demand for both metals, or industrial demand for silver. Such factors change over time. For example, gold has nowadays much higher monetary demand compared to silver than in the past, which largely explains why the average ratio in the 21st century was on average higher than earlier.
What else can we learn from the analysis of the historical gold-to-silver ratio? Well, the chart below shows an interesting pattern. The peaks in ratio are bullish signals, while the bottoms are bearish. Indeed, the gold-to-silver ratio peaked in 2003 and later in 2008, pretty good moments to invest in both gold and silver. Similarly, the bottom in 2011 was an important selling signal, was it not?
Chart 1: The gold-to-silver ratio (the price of gold divided by the price of silver, red line, right axis), the price of gold (yellow line, left axis, London A.M. Fix), and the price of silver (blue line, right axis, London Fix) from 2002 to May 12, 2016.
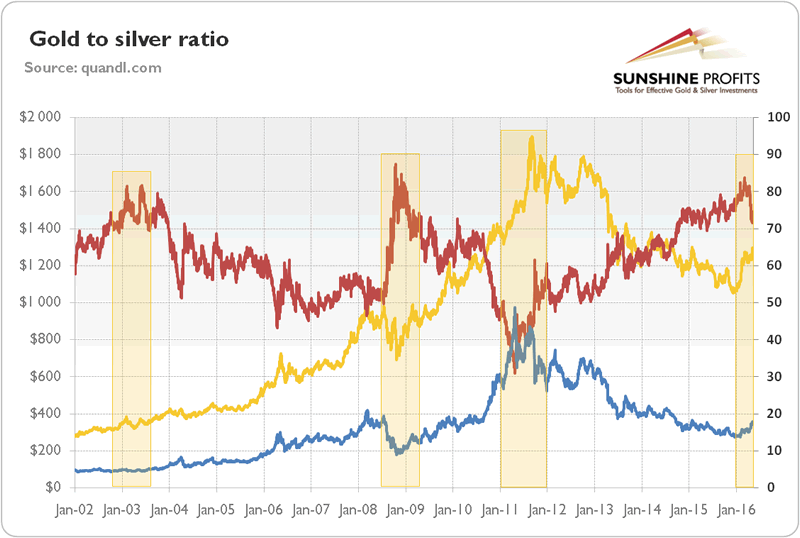
What determines such a tendency? Well, gold leads the dance and silver usually follows. Therefore, during bull markets in the precious metals, gold starts to rally earlier, while silver lags and only later catches up with gold. It makes sense since silver functions mainly as an industrial metal. This is why at the beginning of a precious metals boom, the gold-to-silver ratio increases. As the gold boom intensifies, silver investors also jump on the wagon (we can say that they recall the monetary function of silver and its close relationship with gold, or that the silver market, due to low and volatile silver prices compared to gold, attracts speculators who want to participate in a bull market).The price of silver catches up with gold, so the gold-to-silver ratio declines.
How then can precious metals investors use the gold-to-silver ratio in investing? It should already be clear that when the ratio moves to extremes, it creates a gold and silver trading opportunity for investors. When the ratio is low, it indicates that silver may be overvalued (which is logically equivalent to gold being undervalued). Therefore, if gold buys less than, let’s say, 40 ounces of silver, it may be time to sell silver and buy gold. Similarly, when the ratio is high, it signals that silver may be undervalued. Thus, if gold buys more than, let’s say, 80 ounces of silver, it may be time to buy silver and sell gold.
Another idea would be to view extremes in the ratio as turning points in the entire precious metals sector – the bigger the extreme, the bigger turnaround it could indicate.
However, there is a crucial caveat. Nobody knows for sure the turning points when investors should switch between the precious metals. The ratio may hit 80 (or 40) and continue to expand (dive) for a while, as the fundamentals may change, justifying a new range for the ratio. History does not repeat itself, it only rhymes.
It is important to realize that the decline in the gold-to-silver ratio may correspond with the bull market in both silver and gold – the key to understanding this is the fact the precious metals tend to move in tandem, but gold precedes silver, as mentioned previously. Since the latter accelerates later and acts like “gold on steroids” (silver is more volatile than gold both during upside and downside moves), investing in silver increases potential profits, but also potential losses compared to gold. In other words, the gold-to-silver ratio may signal a trend in both metals. If the ratio is high (let’s say above 80), investors should increase their position in silver relative to gold, but they do not have to actually sell gold. The price of gold in silver ounces is likely to decline, but it does not mean that the U.S. dollar price of gold is also going to drop. Actually, the absolute price of gold should also increase, although at a slower pace than silver prices.
Let’s analyze the chart below to find out what the gold-to-silver ratio tells about the current state of the precious metals market.
Chart 2: The gold-to-silver ratio (the price of gold divided by the price of silver, red line, right axis), the price of gold (yellow line, left axis, London A.M. Fix) and the price of silver (blue line, right axis, London Fix) from 2013 to May 31, 2016.
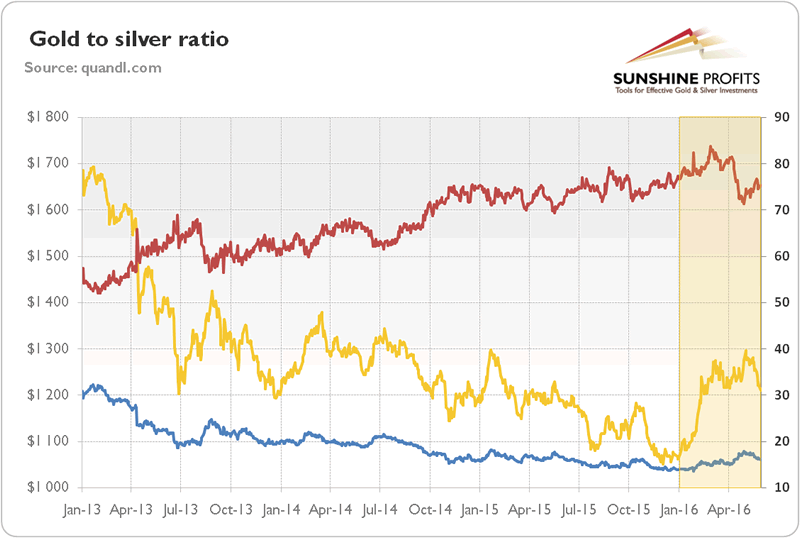
As one can see, the gold-to-silver ratio pushed above 80 in January 2016, reaching a level not seen since 2008. This may signal that gold and silver may begin a new bull market (it, however, doesn’t rule out another big drop in prices, before an expected bull market would begin). It goes without saying that the peak in the ratio may also indicate a recession (just like in 2008) or at least an important economic slowdown. When the economy is slowing down, the industrial demand for silver suffers, while the price of gold is supported by the safe-haven bids. However, the ratio started to decline in April. The drop from the peak came because of an increase in silver prices in April. Silver underperformed gold in the first quarter of 2016, but it accelerated in April. Indeed, the decline in the ratio indicated that silver was rising faster than gold. However, in May the ratio rebounded, as silver decreased more than gold. Despite the recent decline, the ratio is still at relatively elevated level.
Thank you.
If you enjoyed the above analysis and would you like to know more about the gold ETFs and their impact on gold price, we invite you to read the April Market Overview report. If you're interested in the detailed price analysis and price projections with targets, we invite you to sign up for our Gold & Silver Trading Alerts . If you're not ready to subscribe at this time, we invite you to sign up for our gold newsletter and stay up-to-date with our latest free articles. It's free and you can unsubscribe anytime.
Arkadiusz Sieron
Sunshine Profits‘ Market Overview Editor
Disclaimer
All essays, research and information found above represent analyses and opinions of Przemyslaw Radomski, CFA and Sunshine Profits' associates only. As such, it may prove wrong and be a subject to change without notice. Opinions and analyses were based on data available to authors of respective essays at the time of writing. Although the information provided above is based on careful research and sources that are believed to be accurate, Przemyslaw Radomski, CFA and his associates do not guarantee the accuracy or thoroughness of the data or information reported. The opinions published above are neither an offer nor a recommendation to purchase or sell any securities. Mr. Radomski is not a Registered Securities Advisor. By reading Przemyslaw Radomski's, CFA reports you fully agree that he will not be held responsible or liable for any decisions you make regarding any information provided in these reports. Investing, trading and speculation in any financial markets may involve high risk of loss. Przemyslaw Radomski, CFA, Sunshine Profits' employees and affiliates as well as members of their families may have a short or long position in any securities, including those mentioned in any of the reports or essays, and may make additional purchases and/or sales of those securities without notice.
Arkadiusz Sieron Archive |
© 2005-2022 http://www.MarketOracle.co.uk - The Market Oracle is a FREE Daily Financial Markets Analysis & Forecasting online publication.