Germany Stock Market DAX H&S Break Leading ?
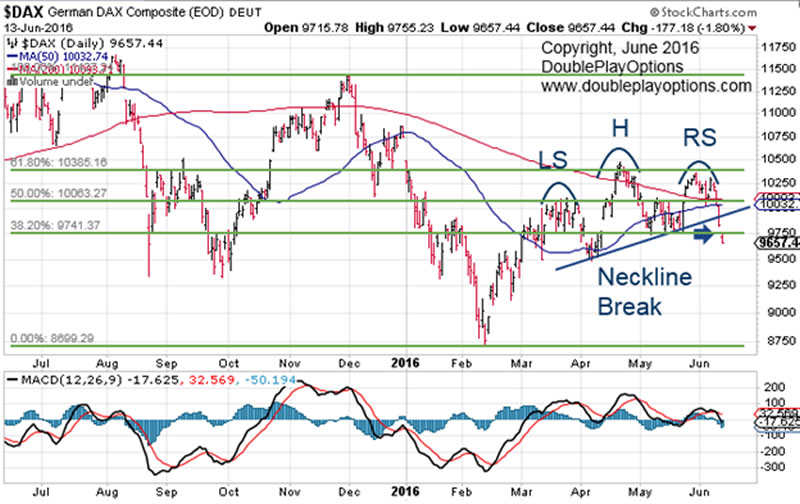
Stock-Markets / Germany Jun 14, 2016 - 01:20 PM GMT Simple daily chart for the last year on the The German Stock Index "DAX" which comprises 30 German blue chip stocks.
Notice the price fib. retracement from early Dec. high to Mid. Feb. low was hit first at the 50%, then 61.8%, then follows a lower high, and lower low. This may lead to lower prices in the near future.
Next take a look at the left shoulder, head, and right shoulder of an apparent H&S with recent neckline break using blue annotations.
The 50dma is currently below the 200 although getting very close.
Last tool on the chart is down at the bottom, the macd indicator. The centerline looks like it may have a bearish crossover any day.

Joseph VanDerveer is the Chief Technical Analyst with 8 years experience in the trenches trading the markets with a brand new website and service at www.doubleplayoptions.com
© 2016 Copyright Joseph VanDerveer - All Rights Reserved
Disclaimer: The above is a matter of opinion provided for general information purposes only and is not intended as investment advice. Information and analysis above are derived from sources and utilising methods believed to be reliable, but we cannot accept responsibility for any losses you may incur as a result of this analysis. Individuals should consult with their personal financial advisors.
© 2005-2022 http://www.MarketOracle.co.uk - The Market Oracle is a FREE Daily Financial Markets Analysis & Forecasting online publication.


