NYA/TLT 2y, Weekly Chart & Analysis - Bearish View
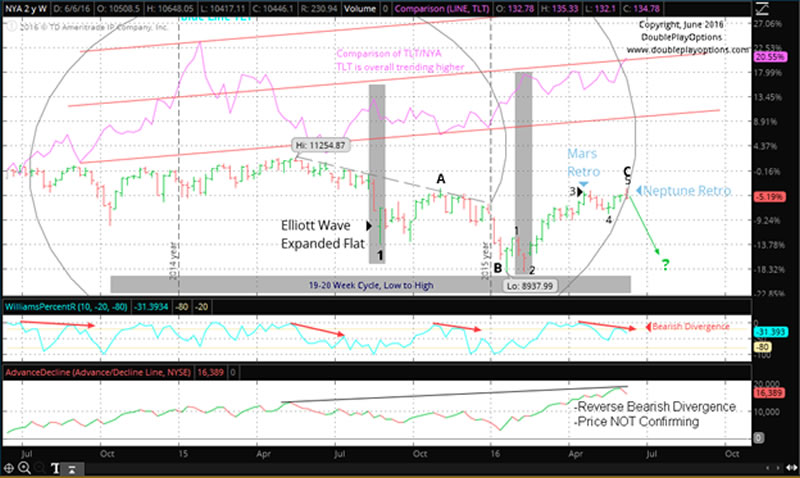
Stock-Markets / Stock Markets 2016 Jun 12, 2016 - 03:52 PM GMTChart below shows a comparison of up-trending TLT and down-trending NYA. I would like to point out the two TLT spikes and lows in the market indicated by the 2 gray vertical boxes. With that in mind, TLT looks to be breaking to the upside with a weekly close higher then previous and mid channel resistance.
Following is a list of indicators and analysis for the chart below.
1. Fib. Spiral relationship from 3 locations
2. TLT spikes indicated by the gray vertical boxes, with market lows.
3. Mars Retro. at the 4/20 high, and Neptune Retro. near the 19-20 week cycle high and 6 month cycle high currently not showing on the chart.
4. 19-20 week cycle, low to high indicated by the horizontal gray box.
5. Possible scenario with Elliott Wave Theory showing a major market turn with flat correction, everyone can interpret this differently.
6. TLT is the top violet color line, and NYA or NYSE is the colored bars below.
7. 1st indicator down below starting with Williams %R, proper way to use this indicator is shown, we are clearly not in an uptrend to be mistakenly trying to short by swing traders like myself, which is one of the biggest mistakes. We are clearly in a sideways to slightly down-trend market, shown by NYSE over the past 2 years. This consolidation with the Williams %R indicator should give us a higher probability suggestion. It is also suggesting a bearish divergence, again, in a non-up-trending market in the bigger picture.
8. 2nd indicator and last clue I am going to show you is not as well known among technical analysts. The A/D line shown below clearly shows a higher high. No one will argue this but my interpretation is called a reverse bearish divergence which can make your head spin. Basically it means price made a lower high and the indicator made a higher high which can indicate a reversal. Sometimes this can fail, just like any indicator and the interpretation of them.

Joseph VanDerveer is the Chief Technical Analyst with 8 years experience in the trenches trading the markets with a brand new website and service at www.doubleplayoptions.com
© 2016 Copyright Joseph VanDerveer - All Rights Reserved
Disclaimer: The above is a matter of opinion provided for general information purposes only and is not intended as investment advice. Information and analysis above are derived from sources and utilising methods believed to be reliable, but we cannot accept responsibility for any losses you may incur as a result of this analysis. Individuals should consult with their personal financial advisors.
© 2005-2022 http://www.MarketOracle.co.uk - The Market Oracle is a FREE Daily Financial Markets Analysis & Forecasting online publication.


