


US Equity Uptrend Continues
Stock-Markets / Stock Markets 2016 Jun 11, 2016 - 03:02 PM GMTBy: Tony_Caldaro

 The week started off at SPX 2099. On Monday, Tuesday, and Wednesday the market moved higher, without dropping below SPX 2099, and hit SPX 2121. Then on Thursday and Friday the market pulled back to SPX 2090, before ending the week at 2096. For the week the SPX/DOW were -0.25%, and the NDX/NAZ were -1.0%. Economic reports for the week were light and mixed. On the downtick: investor holdings, consumer credit/sentiment. On the uptick: wholesale inventories, plus weekly jobless claims and the budget deficit improved. Next week will be highlighted by the FOMC meeting, and Industrial production.
LONG TERM: neutral
Last weekend we presented our opinion of the bifurcation between the futures driven and cash driven US indices. The SPX/DOW/NDX all appear to be in a bear market rally, while the NYSE appears to be in a Primary wave V. The latter count is probably the most popular among in the EW world. As a result of this bifurcation we shifted our long term view to neutral.
While it is easy to look at a chart, after a market has progressed, and label it with what appears to be the most obvious count. We do not have that option with medium and long term trends. The OEW model quantifies these trends, and we are forced to label waves where they have actually began and ended. As a result, our labeling is not always what appears to be the most obvious count. Sometimes a potential count arises that few, if any, have even considered. We currently have such a count, but will not present it at this time as we await additional market data. All we will say is that it is more bullish than either of the two counts presented above.
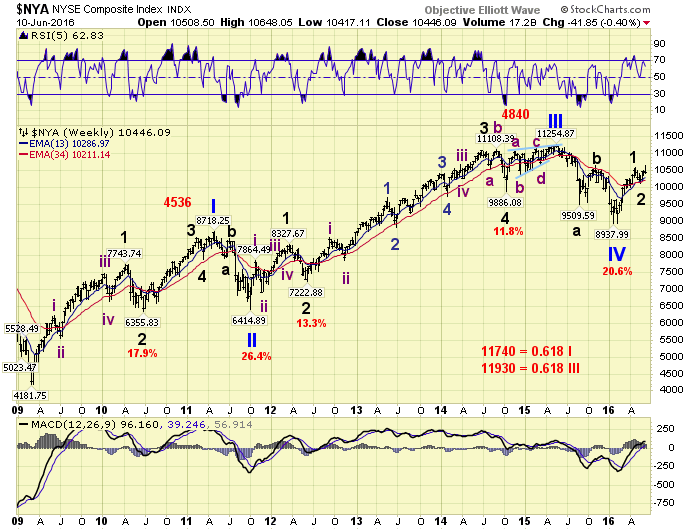
Currently the P5 scenario for the NYSE is progressing positively. As that index moved above the Major 1 high just this week, in Major 3, before the late week pullback. Potential upside P5 targets are posted on the chart: starting with a marginal new high, then NYSE 11,740 and NYSE 11,930.
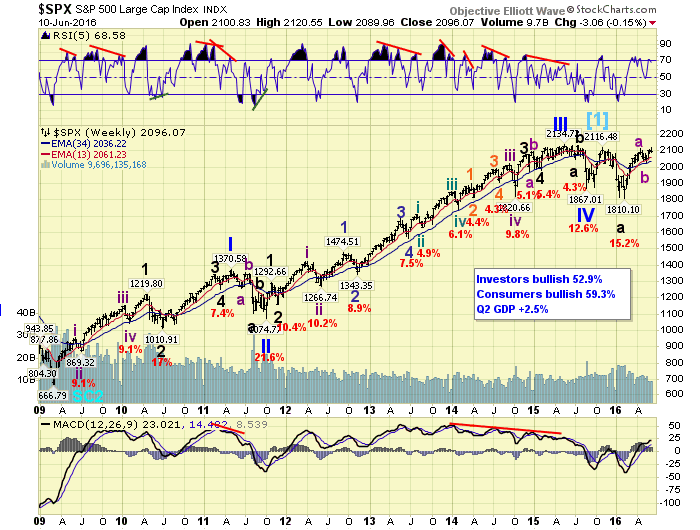
Should any of these targets be reached, this would of course suggest new all time highs in the SPX. Whenever the SPX makes new highs the bear market rally count will have to be updated. The February SPX 1810 low would be relabeled Primary A, and the advance from that low an ongoing Primary B. When P5 in the NYSE completes, Primary wave C in the SPX and, a bear market in the NYSE would soon be underway.
MEDIUM TERM: uptrend
The current uptrend, from the recent SPX 2026 downtrend low, made a new high this week and a new high for the rally from the February SPX 1810 low. This suggests, like the NYSE, the overall market is currently in its third wave up from the February low. And, is likely to continue to move higher.
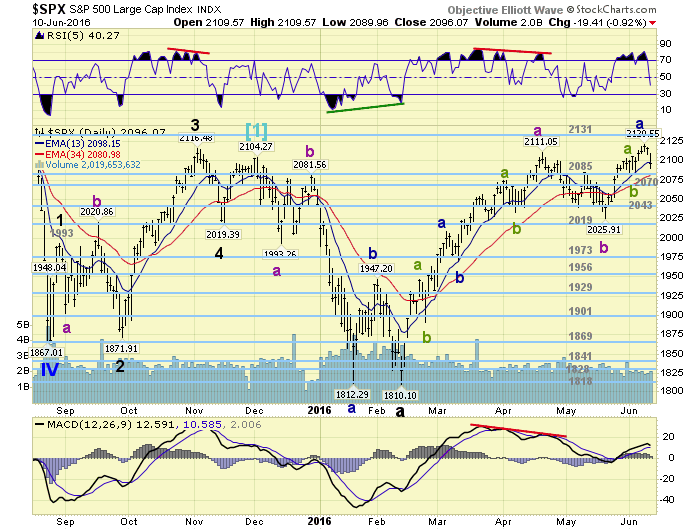
The internal count for the February to April uptrend has come under some scrutiny lately. We have been presenting it as a double three corrective advance. For a corrective bear market rally this seems appropriate. However, after a closer look, it is possible to count this uptrend as impulsive by adding just one small wave that we may have overlooked. While OEW does consistently quantify medium/long term trends. It does not consistently quantify small waves within medium term trends. Bull/bear market characteristics are different, due to volatility. Therefore, one must know exactly which is unfolding to apply the proper short term metric.
Currently we are watching the recent pullback with interest. As we think it will clear up the corrective/impulsive medium term question. For now we will leave the short term counts as presented, subject to change. Medium term support is at the 2085 and 2070 pivots, with resistance at the 2131 pivot.
SHORT TERM
As noted above there are two possible short term counts within the last uptrend, and this uptrend as well. Putting the last uptrend aside, we look at the current uptrend. We have been counting this uptrend, from SPX 2026, as an a-b-c. Yet when we include a small overlooked wave, using a bullish metric, we arrive at five waves up to SPX 2121: 2056-2047-2103-2085-2121. Which count is correct, the corrective or implusive? The current pullback, from SPX 2121, should provide the answer.
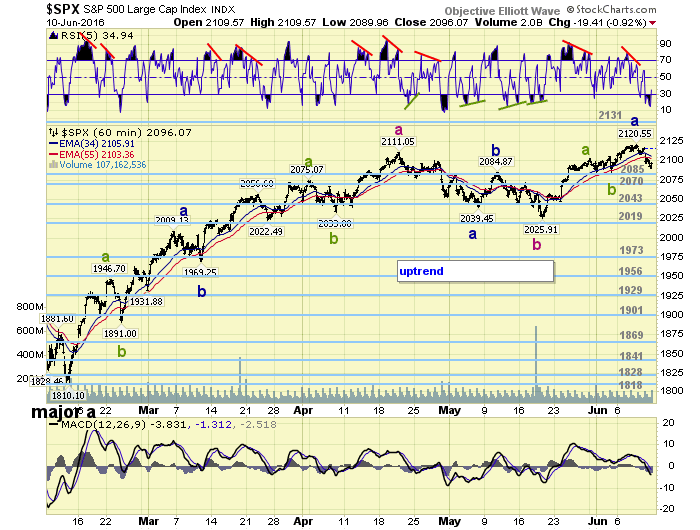
Short term support is at the 2085 and 2070 pivots, with resistance at SPX 2121 and the 2131 pivot. Short term momentum was quite oversold during Friday’s pullback. Best to your trading!
FOREIGN MARKETS
Asian markets were mixed on the week for a gain of 0.3%.
European markets were all lower for a loss of 2.9%.
Commodity equity indices were mixed for a loss of 0.2%.
The DJ World index is in an uptrend but lost 0.8% on the week.
COMMODITIES
Bonds are in an uptrend and gained 0.4% on the week.
Crude remains in an uptrend, big volume Friday, and gained 0.4% on the week.
Gold looks like it is in an uptrend and gained 2.4% on the week.
The USD is also in an uptrend and gained 0.7% on the week.
NEXT WEEK
Tuesday: export/import prices, retail sales and business inventories. Wednesday: the PPI, NY FED, industrial production, and the FOMC meeting ends. Thursday: the CPI, weekly jobless claims, the Philly FED and the NAHB. Friday: building permits, housing starts and options expiration. Best to your weekend and week!
CHARTS: http://stockcharts.com/public/1269446/tenpp
After about 40 years of investing in the markets one learns that the markets are constantly changing, not only in price, but in what drives the markets. In the 1960s, the Nifty Fifty were the leaders of the stock market. In the 1970s, stock selection using Technical Analysis was important, as the market stayed with a trading range for the entire decade. In the 1980s, the market finally broke out of it doldrums, as the DOW broke through 1100 in 1982, and launched the greatest bull market on record.
Sharing is an important aspect of a life. Over 100 people have joined our group, from all walks of life, covering twenty three countries across the globe. It's been the most fun I have ever had in the market. Sharing uncommon knowledge, with investors. In hope of aiding them in finding their financial independence.
Copyright © 2016 Tony Caldaro - All Rights Reserved Disclaimer: The above is a matter of opinion provided for general information purposes only and is not intended as investment advice. Information and analysis above are derived from sources and utilising methods believed to be reliable, but we cannot accept responsibility for any losses you may incur as a result of this analysis. Individuals should consult with their personal financial advisors.
Tony Caldaro Archive |
© 2005-2022 http://www.MarketOracle.co.uk - The Market Oracle is a FREE Daily Financial Markets Analysis & Forecasting online publication.