


Swing Trading Day Trading
InvestorEducation / Forex Trading Jun 09, 2016 - 05:10 PM GMTBy: Chris_Drinkwater

 I have had a few questions lately from students regarding the difference between swing trading and day trading. At its core swing trading means holding for a few days or weeks whilst in day trading you execute the trade and close it in the same day. You may use the same strategy for either time frame.
Let's take a look at the USD/JPY 4 hour chart. If you intend to swing trade you MUST use a higher time frame such as the 4 hour or daily chart.
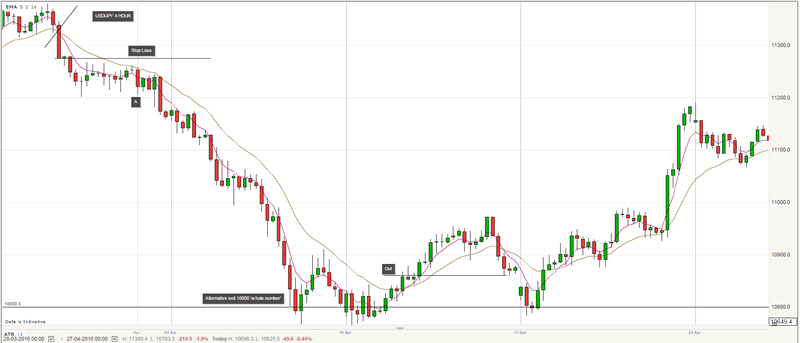
Here I am going to demonstrate a very simple strategy using a 5 period ema and a 16 period ema.
When the 5 ema crosses the 16 ema that is indicative of a possible change of direction, it is not certain as moving average crosses can whipsaw in and out, which is why you must wait until a candle has printed over the 16 ema to confirm this possible direction change. The cross is indicated by the diagonal line .
The entry is the subsequent retrace and touch of the 16 ema as indicated at A.
The stop loss position would be at the first obvious point of support / resistance located here at the bottom of the first candle to print under the 16 ema
The strategy here is to stay in the trade until the 5 ema crosses back over the 16 ema or the price prints above the 16 ema as indicated at B. There is a more aggressive exit at C after a failed swing, this is also a whole number.
In the first example here that shows a return of 390 points for a 12 day swing trading plan.
Move swing trading stop loss position
In a trend the price action will make a series of swing points.. The stop strategy is to move your stop first from the initial stop to the first swing point and then move it as each swing point is printed.,
Day Trading
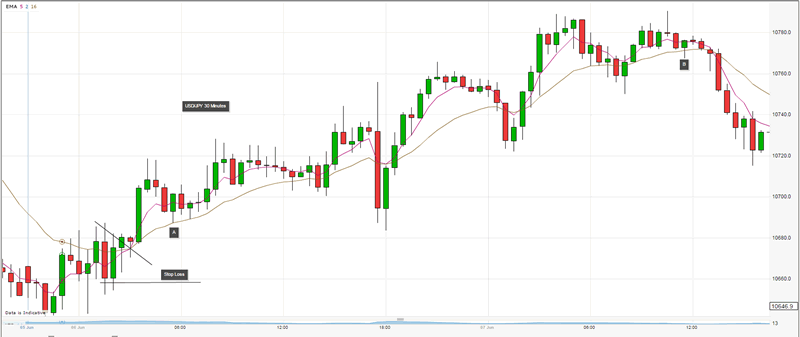
For a day trading strategy you need to be operating in a lower time frame. I suggest 30 minutes as it cuts out a lot of the 'noise' that you get from the 5 and 10 minute time frames.
Let's take a look at the 30 minute chart of the same USD/JPY pair 3-4 may 2016.
There are many more opportunities to enter on a 30 minute chart as the price action hits the 16 ema more often, however there are more decisions to make and the risk of getting the trade direction wrong is higher. Here though we can make an entry after the ema cross and retracement to the 16 ema.
You can move the stop along with the swing points as we did in the swing trading example, however if day trading you must close by 4.30 pm as that it the London close time.
Chris Drinkwater
www.Animusfx.com
I am a successful Day / Swing Trader and Partner in a local business in the South West of the UK.
I have been trading now for 10 years and in that time have accumulated a huge amount of screen time and experience, with many thousands of trades taken in that time.
I am acutely aware how difficult it is for anyone starting out in this trading business and how much information in the public domain is inaccurate, out of date or just plain wrong.
We started our website with the intention of educating newcomers and giving them the tools they need to increase their confidence, consistency and discipline in trading.
We now have over 250 students in 49 countries across the world and we are growing fast!
© 2016 Chris Drinkwater - All Rights Reserved
Disclaimer: The above is a matter of opinion provided for general information purposes only and is not intended as investment advice. Information and analysis above are derived from sources and utilising methods believed to be reliable, but we cannot accept responsibility for any losses you may incur as a result of this analysis. Individuals should consult with their personal financial advisors.
© 2005-2022 http://www.MarketOracle.co.uk - The Market Oracle is a FREE Daily Financial Markets Analysis & Forecasting online publication.