Most Popular
1. It’s a New Macro, the Gold Market Knows It, But Dead Men Walking Do Not (yet)- Gary_Tanashian
2.Stock Market Presidential Election Cycle Seasonal Trend Analysis - Nadeem_Walayat
3. Bitcoin S&P Pattern - Nadeem_Walayat
4.Nvidia Blow Off Top - Flying High like the Phoenix too Close to the Sun - Nadeem_Walayat
4.U.S. financial market’s “Weimar phase” impact to your fiat and digital assets - Raymond_Matison
5. How to Profit from the Global Warming ClImate Change Mega Death Trend - Part1 - Nadeem_Walayat
7.Bitcoin Gravy Train Trend Forecast 2024 - - Nadeem_Walayat
8.The Bond Trade and Interest Rates - Nadeem_Walayat
9.It’s Easy to Scream Stocks Bubble! - Stephen_McBride
10.Fed’s Next Intertest Rate Move might not align with popular consensus - Richard_Mills
Last 7 days
US Bond Market Panic Continues Towards May Expected Japanese Rate Hike Volatility Spike - 24th April 25
Stock Market Tarrified as President Dump Risks Turning Recession into Stagflationary Depression - 21st April 25
President Dump Delivers BEAR MARKET - Stock Market Battles Between Order and Chaos - 7th April 25
Stocks Bull Market End Game Bear Start Strategy - 20th Mar 25
Gold and System Collapse: Charting the Bank Run of the Mighty US Dollar - 20th Mar 25
Tesla's Troubles — Is it Musk or is it More? - 20th Mar 25
The Stock Market Bear / Crash indicator Window - 9th Mar 25
Big US Tech Stocks Fundamentals - 9th Mar 25
No Winners When The Inflation Balloon Pops - 9th Mar 25

Market Oracle FREE Newsletter

How to Protect your Wealth by Investing in AI Tech Stocks

TLT & SPY Inverse Correlation

Stock-Markets / Stock Markets 2016 Jun 08, 2016 - 04:25 AM GMT

By: Joseph_VanDerveer

Stock-Markets

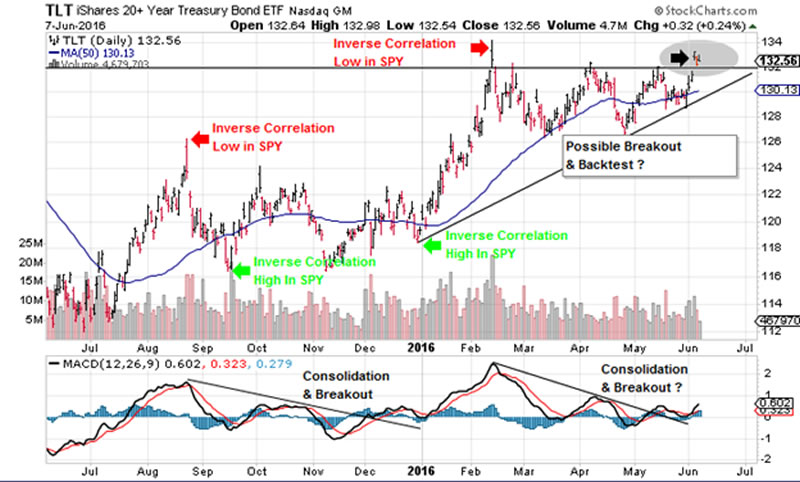
Here is an interesting chart below showing TLT which is iSHARES 20 year plus Treasury Bonds exchange-traded fund.

The red arrows and comments represent major lows in SPY or QQQ's.  The green arrows and comments represent major highs in SPY or QQQ's.


Taking that a bit further, we have a rising trendline with a possible breakout of the horizontal line acting as resistance.

Last and not least is the daily macd indicator at the bottom.  Notice the potential consolidation and breakout.

Sometime these can fail, but it is worth watching and may add a piece of the market puzzle.

Joseph VanDerveer is the Chief Technical Analyst with  8 years experience in the trenches trading the markets  with a brand new website and service at  www.doubleplayoptions.com

© 2016 Copyright  Joseph VanDerveer - All Rights Reserved

Disclaimer: The above is a matter of opinion provided for general information purposes only and is not intended as investment advice. Information and analysis above are derived from sources and utilising methods believed to be reliable, but we cannot accept responsibility for any losses you may incur as a result of this analysis. Individuals should consult with their personal financial advisors.


© 2005-2022 http://www.MarketOracle.co.uk - The Market Oracle is a FREE Daily Financial Markets Analysis & Forecasting online publication.


Post Comment

Only logged in users are allowed to post comments. Register/ Log in