On the Price of Oil
Commodities / Crude Oil Jun 02, 2016 - 07:04 PM GMTBy: Steve_H_Hanke

 Since its high of almost $108/bbl in June of 2014, we have witnessed a stunning collapse in the price of oil. Indeed, in February 2016, a barrel of West Texas Intermediate (WTI) was trading at $26/bbl, a 76 percent plunge from the June 2014 highs. It has since clawed its way back to $49/bbl (May 24th).
What caused the price collapse of this all-important commodity, and where is its price headed? When looking for the causes of price change, nothing beats a sound supply-demand analysis. In the past few years, the United States has played a big role in affecting the world’s oil supply picture. The U.S. was once the world’s largest producer and exporter of oil, and by 1970, its production peaked at 9.6 million barrels per day. Then, a long decline set in, and by 2008, U.S. oil production had been slashed to 50 percent of its peak.

Two new technologies – hydraulic fracturing and horizontal drilling – turned oil and gas production in the U.S. around dramatically in a few short years. By the start of 2015, oil production in the U.S. was 80 percent higher than it had been in 2008. The increase of 4.1 million barrels per day exceeded the comparable increase in every OPEC country but Saudi Arabia.
So, there was a supply surge led by the U.S. In addition, the world was mired in slow growth following the financial crisis of 2008-09. The supply-demand factors finally caught up with the oil market in June 2014, when the market started to roll over. By the time of the 166th OPEC meeting in November 2014, the price of a barrel of WTI had fallen from $108/bbl to $74/bbl, a 31.5 percent plunge. Then, a historic decision was announced at the meeting. In what became known as a “battle for market share,” the members of OPEC stated that they would allow market forces to determine oil prices. On that announcement, oil prices shed another 8 percent in one day.
Since that historic November 2014 OPEC meeting, there has been a great deal of shadow boxing among producers and an endless stream of forecasts about the future course of oil prices. One move that merits particular attention is that of Prince Mohammed bin Salman of Saudi Arabia. With Prince Mohammed’s Vision 2030 plan, it looks like the battle for market share will be the law of the land for the foreseeable future.
To understand the economics behind the Saudi production increase in their quest to maintain market share, we must understand the forces that might cause the Saudis to increase their discount rates.
When it comes to the political instability in the Middle East, the popular view is that increased tensions in the region will reduce oil production. However, economic analysis suggests that political instability and tensions (read: less certain property rights) will work to increase discount rates, which will increase oil production.
Let’s suppose that the real risk-adjusted rate of discount for the Saudis, without any prospect of property expropriation, is 20 percent. Now, consider what would happen to the discount rate if there were a 50-50 chance that a belligerent will overthrow the House of Saud within the next 10 years. In this case, there would be a 6.7 percent chance of an overthrow in any given year. This risk to the Saudis would cause them to compute a new real risk-adjusted rate of discount, with the prospect of having their oil reserves expropriated. In this example, the relevant discount rate would increase to 28.6 percent from 20 percent. This discount rate increase would cause the present value of reserves to decrease dramatically. For example, the present value of $1 in 10 years at 20 percent is $0.16, while it is worth only $0.08 at 28.6 percent. The reduction in the present value of reserves will make increased current production more attractive.
So, the Saudi princes are panicked and pumping oil today – a ‘take the money and run’ strategy – because they know the oil reserves might not be theirs tomorrow. In short, problematic property rights encourage rapid exploitation.
This sets the stage for what is the big question on everyone’s mind: where is the price of oil going from here? To answer that question, we have to have a model – a way of thinking about the problem. In this case, a starting point is Roy W. Jastram’s classic study, The Golden Constant: The English and American Experience 1560-2007. In that work, Jastram finds that gold maintains its purchasing power over long periods of time, with the prices of other commodities adapting to the price of gold. Taking the broad lead from Jastram, my colleague, David Ranson, produced a study in April 2015 in which he used the price of gold as a long-term benchmark for the price of oil. The idea being that, if the price of oil changes dramatically, the oil-gold price ratio will change and move away from its long-term value. Forces will then be set in motion to move supply and demand so that the price of oil changes and the long-term oil-gold price ratio is reestablished. This is nothing more than a reversion to the mean.
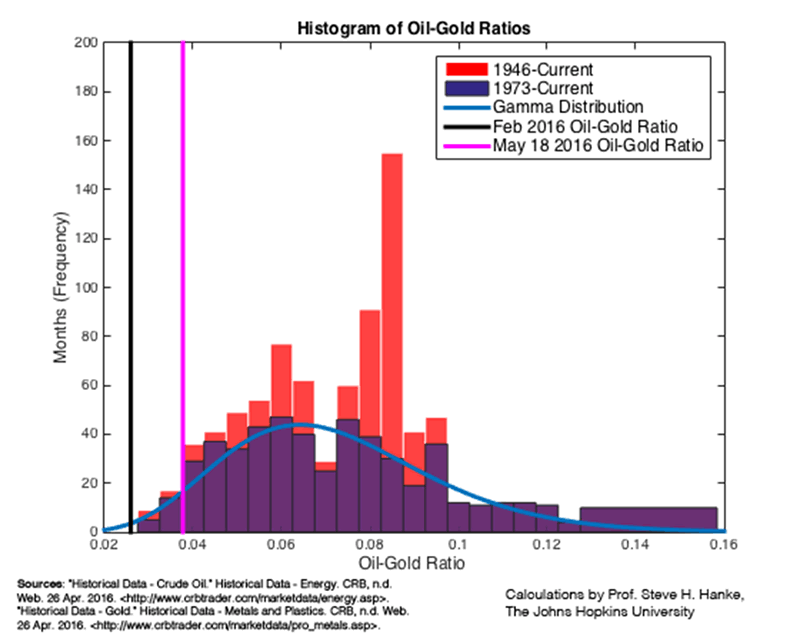
We begin our analysis of the current situation by calculating the oil-gold price ratios for each month. For example, as of May 24th, oil was trading at $49.24/bbl and gold was at $1231.10/oz. So, the oil-gold price ratio was 0.040. In June 2014, oil was at $107.26/bbl and gold was at $1314.82/oz, yielding an oil-gold price ratio of 0.082. The ratios for two separate periods are represented in the accompanying histogram – one starting in 1946 and another in 1973 (the post-Bretton Woods period).
Two things stand out in the histogram: the recent oil price collapse was extreme – the February 2016 oil-gold price ratio is way to the left of the distribution, with less than one percent of the distribution to its left. The second observation is that the ratio is slowly reverting to the mean, with a May 2016 ratio approaching 0.04.
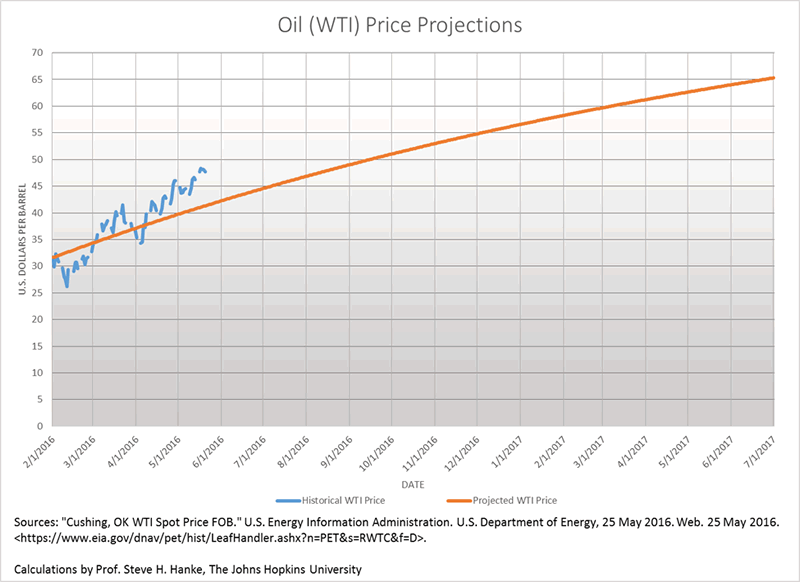
But, how long will it take for the ratio to mean revert? My calculations (based on post-1973 data) are that a 50 percent reversion of the ratio will occur in 13.7 months. This translates into a price per barrel of WTI of $60 by March 2017. It is worth nothing that, like Jastram, I find that oil prices have reverted to the long-run price of gold, rather than the price of gold reverting to that of oil. So, the oil-gold price ratio reverts to its mean via changes in the price of oil.
The accompanying chart shows the price projection based on the oil-gold price ratio model. It also shows the historical course of prices. They are doing just what the golden constant predicts: oil prices are moving up.

The report that motivated this line of inquiry is: R. David Ranson. “Tactical Asset Selection: Implications of Cheap Crude Oil for Its Future Price Trajectory,” Cambria, California: HCWE Worldwide Economics, April 17, 2015.
I would also like to acknowledge excellent research by the following research assistants at The Johns Hopkins Institute for Applied Economics, Global Health, and the Study of Business Enterprise: Stephen Johannesson, Pranay Orugunta, Anshul Subramanya, and Jennifer Zheng.
By Steve H. Hanke
www.cato.org/people/hanke.html
Twitter: @Steve_Hanke
Steve H. Hanke is a Professor of Applied Economics and Co-Director of the Institute for Applied Economics, Global Health, and the Study of Business Enterprise at The Johns Hopkins University in Baltimore. Prof. Hanke is also a Senior Fellow at the Cato Institute in Washington, D.C.; a Distinguished Professor at the Universitas Pelita Harapan in Jakarta, Indonesia; a Senior Advisor at the Renmin University of China’s International Monetary Research Institute in Beijing; a Special Counselor to the Center for Financial Stability in New York; a member of the National Bank of Kuwait’s International Advisory Board (chaired by Sir John Major); a member of the Financial Advisory Council of the United Arab Emirates; and a contributing editor at Globe Asia Magazine.
Copyright © 2016 Steve H. Hanke - All Rights Reserved
Disclaimer: The above is a matter of opinion provided for general information purposes only and is not intended as investment advice. Information and analysis above are derived from sources and utilising methods believed to be reliable, but we cannot accept responsibility for any losses you may incur as a result of this analysis. Individuals should consult with their personal financial advisors.
Steve H. Hanke Archive |
© 2005-2022 http://www.MarketOracle.co.uk - The Market Oracle is a FREE Daily Financial Markets Analysis & Forecasting online publication.


