Why Technical Analysis Does Not Work for Gold and Silver
Commodities / Gold and Silver 2016 Jun 02, 2016 - 06:17 AM GMTBy: The_Gold_Report
 Michael Ballanger, a precious metals expert, says he believes technical charts were created by bullion bank traders to lull the "chartists" into a false sense of security.

I often include charts in my weekly missives for a number of reasons, but the truth of the matter is that they add a little color to what would normally be a pretty drab bombardment of opinion delivered via text. By adding charts, it creates the illusion that I actually understand technical analysis (which I don't other than what I gleaned during a two week training program in 1977 while in the employ of McLeod Young and Weir) and that it is useful in the forecasting of price trends in gold and silver over the long term. Well, I have a secret to tell you—"T.A." (as it is called by the "in crowd") is USELESS. "Cup and handles," "hanging Chinamen, "engulfing knickers," "tombstone dojis"—you can fire them all in the waste bin because that is precisely where they belong.
I was reading a certain metals report last night where, sure enough, the author missed the top by a country mile, albeit he admitted it and apologized to his subscribers (which was truly admirable). I found it interesting that in order for him to get a "clue" to the next move in gold, he would have to "turn to the charts." So what I will do now is turn to MY charts and demonstrate in no uncertain terms why charts are CREATED by the bullion bank traders in order to trap the "chartists" (and their subscribers) into false senses of security.
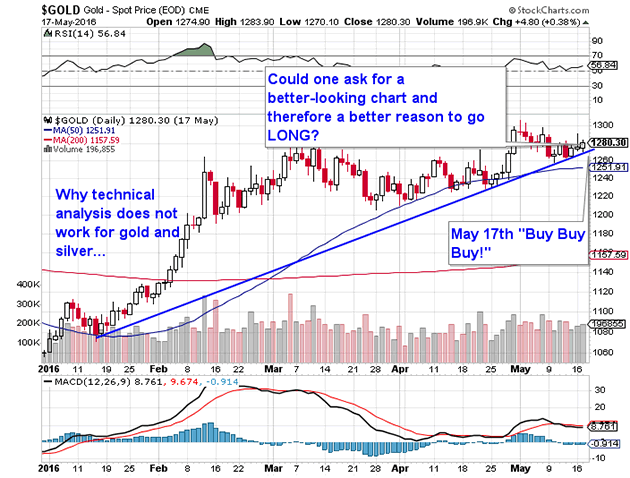
Above is a wonderfully bullish TEXTBOOK chart of gold from May 17, when the author of this newsletter told everyone to look for a big up move. . .
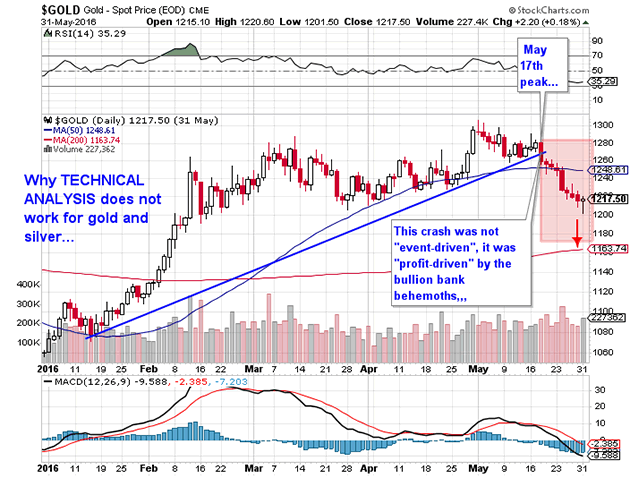
The next chart provided below was what actually happened to the gold market AFTER the 17th and everyone points to Janet Yellen's hawkish call from the FOMC minutes and ensuing rally in the USD, but the reality was that it really wasn't "event-driven" (by the Fed). It was "profit-driven" by a group of colluding criminals who fed carload after carload of synthetic gold by way of the Comex into the market in the $1,280—$1,300 range, which absorbed all of the upward price pressure exerted by Large and Small Speculators as open interest exploded to all-time highs. Notice how they kept the price movement perfectly aligned to the rising uptrend line during the last week of the advance during which the chart pattern evoked a gargantuan response from the chart-watchers seen by the explosion in open interest to nearly 600,000 contracts. That was the perfect technical "set-up" to the heist.

So the next time you sign into your favorite pay-site (whether it is $10/month or $100/month) and you find yourself watching a podcast or an interview where technical analysis is the topic of debate, shut off your device and run for the hills. The Commercials were short a record (or near-record) 295,000 contracts in early May near the top and they simply pulled the ripcord on May 18 when the news headlines provided "cover." Eight consecutive red candles in a row until yesterday as the Commercials are most certainly ringing the register with a euphoric pre-Hampton's bonus hunt as we unwind into summer. To repeat: this had NOTHING to do with "T.A."; it had EVERYTHING to do with interventions (Thank you, Exchange Stabilization Fund and NY Fed), manipulations (Thank you, U.S. Commodity Futures Trading Commission) and favoritism (Thank you, Securities and Exchange Commission and Department of Justice).
The good news as we move forward is that the Cretins have gorged themselves pretty good the past eight sessions as open interest has shrunk rapidly, indicating the crystallization of profits by the bullion banks and losses by everybody else. The Cyborgs controlling the gold market will probably be close to taking their heels off the throats of gold and silver by mid-next-week and after we get the Bureau of Labour Statistics number on Friday. In my imperfect world, a fast-and-furious drop Friday to $1,160–1,180 would complete the heist, but more than likely we see a rebound to $1,240–1,250 before we head lower into a mid-summer nadir with Commercial net shorts back under 50,000 contracts.
"In the hold of every sunken ship, you will always find a chart" is how the saying goes, so keep that in mind every time they try to sell you a set of knives or, more appropriately, every time they try to get you to buy some bogus "metals analysis" using chart analysis as the valued-added proposition.
Originally trained during the inflationary 1970s, Michael Ballanger is a graduate of Saint Louis University where he earned a Bachelor of Science in finance and a Bachelor of Art in marketing before completing post-graduate work at the Wharton School of Finance. With more than 30 years of experience as a junior mining and exploration specialist, as well as a solid background in corporate finance, Ballanger's adherence to the concept of "Hard Assets" allows him to focus the practice on selecting opportunities in the global resource sector with emphasis on the precious metals exploration and development sector. Ballanger takes great pleasure in visiting mineral properties around the globe in the never-ending hunt for early-stage opportunities.
Disclosure:
1) Statements and opinions expressed are the opinions of Michael Ballanger and not of Streetwise Reports or its officers. Michael Ballanger is wholly responsible for the validity of the statements. Streetwise Reports was not involved in any aspect of the article preparation or editing so the author could speak independently about the sector. Michael Ballanger was not paid by Streetwise Reports LLC for this article. Streetwise Reports was not paid by the author to publish or syndicate this article.
2) This article does not constitute investment advice. Each reader is encouraged to consult with his or her individual financial professional and any action a reader takes as a result of information presented here is his or her own responsibility. By opening this page, each reader accepts and agrees to Streetwise Reports' terms of use and full legal disclaimer. This article is not a solicitation for investment. Streetwise Reports does not render general or specific investment advice and the information on Streetwise Reports should not be considered a recommendation to buy or sell any security. Streetwise Reports does not endorse or recommend the business, products, services or securities of any company mentioned on Streetwise Reports.
3) From time to time, Streetwise Reports LLC and its directors, officers, employees or members of their families, as well as persons interviewed for articles and interviews on the site, may have a long or short position in securities mentioned. Directors, officers, employees or members of their families are prohibited from making purchases and/or sales of those securities in the open market or otherwise during the up-to-four-week interval from the time of the interview until after it publishes.
All charts courtesy of Michael Ballanger
© 2005-2022 http://www.MarketOracle.co.uk - The Market Oracle is a FREE Daily Financial Markets Analysis & Forecasting online publication.


