S&P Significant Low has Occurred – Not Likely!
Stock-Markets / Stock Markets 2016 May 26, 2016 - 06:48 PM GMTBy: DeviantInvestor
 There are patterns in markets. Yes, the Fed and High Frequency Traders influence markets, but we can learn from past patterns in the S&P 500 Index.
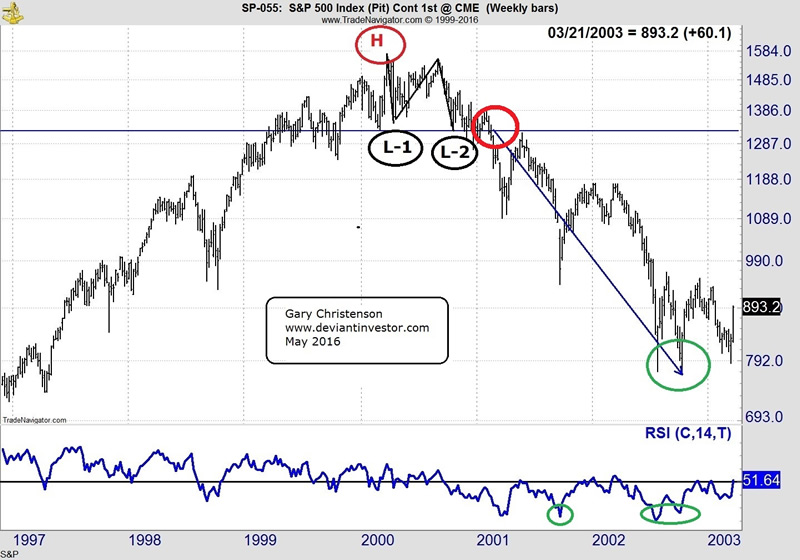
Using weekly data, the S&P made a high in March 2000, fell to an initial low in April, rose, and fell to a second low in October 2000. It rallied and fell below the second low in February 2001 – never to look back. From high to final low took 931 calendar days and price fell about 51%.
Examine the following chart and note the H, L-1, L-2 and a final low.

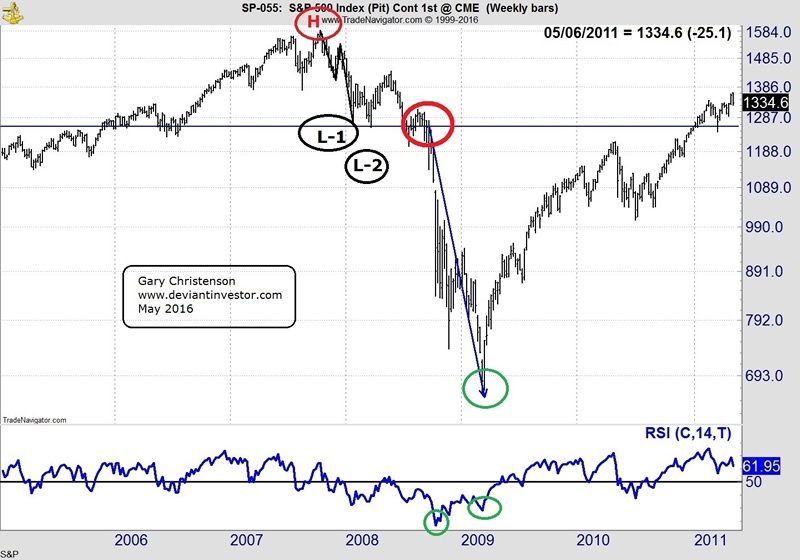
A similar pattern is visible after the 2007 top. Using weekly data, the S&P made a high in October 2007, fell to an initial low in November, rose, and fell to a second low in January 2008. It rallied and fell steeply below the second low in September 2008 – never to look back. From high to final low took 511 calendar days and price fell about 58%.

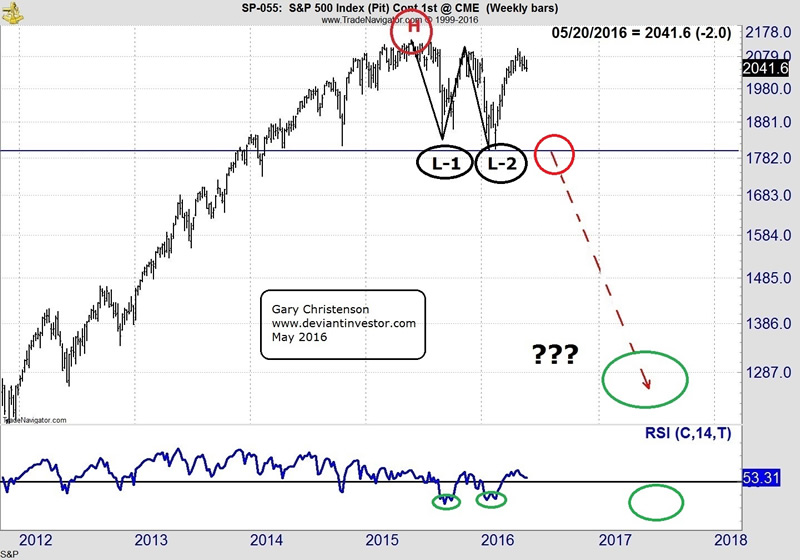
Examine the chart for the 2015 version of the S&P high to low progression.

A high is clearly visible, along with a first low and a second low. The S&P has not yet fallen below L-2 at about 1804, but when it does, look out below. Of course this time could be different, our central banks might “save” the S&P, market corrections might have been banished into the dustbin of history, the incredibly excessive global debt may not matter, and the Easter Bunny might be real, but none of those seem like good bets.
SPECULATION based on the last two cycles: These are not predictions – just possibilities based on history. As I said, this time might be different, the incredibly high S&P might be levitated until past the election so that a “status quo” friendly candidate can be elected President in November 2016, and the Easter Bunny…
Time from high to low in the 2000 cycle was 931 days – about 2.5 years. The 2007 cycle was deeper and quicker – 511 days or about 1.4 years. Assume the range for the 2015 cycle is longer than the last cycle, since it appears to have an extended and rounded top – so guess that high to low takes about 2 – 2.5 years – which suggests a low about 2017Q2 – 2017Q4.
Prices from high to low in the 2000 cycle declined 51%. The 2007 decline was slightly larger at 58%. Assume a 50 – 60% decline in this cycle. That puts the S&P in the vicinity of 850 to 1050. Of course this time might be different…
IN ADDITION:
Using the Relative Strength Index as shown at the bottom of the charts, we can see that the 2000 cycle bottomed with RSI readings (scale 0 – 100) in the 20s on the weekly charts and about 27 on the monthly chart.
Those RSI readings were as low as 16.45 weekly in October 2008, and 18.1 on the monthly in March 2009.
Those RSI readings in the 2015 cycle have only dropped to the 30s on the weekly and to about 49 on the monthly. Either this time is very different, or the RSI reading must drop far lower to indicate a lasting bottom. Expect to see monthly RSI readings around 20 in 2017 – 2018 at a much lower low in the S&P 500 Index.
Of course this time might be different, but it seems wise to consider the possibility of a substantial S&P 500 Index drop in coming months. Today – May 20 – is the one year anniversary of the S&P 500 market top last year.
Gary Christenson
GE Christenson aka Deviant Investor If you would like to be updated on new blog posts, please subscribe to my RSS Feed or e-mail
© 2016 Copyright Deviant Investor - All Rights Reserved Disclaimer: The above is a matter of opinion provided for general information purposes only and is not intended as investment advice. Information and analysis above are derived from sources and utilising methods believed to be reliable, but we cannot accept responsibility for any losses you may incur as a result of this analysis. Individuals should consult with their personal financial advisors.
Deviant Investor Archive |
© 2005-2022 http://www.MarketOracle.co.uk - The Market Oracle is a FREE Daily Financial Markets Analysis & Forecasting online publication.


