


Is There A Stocks Bear Market in Progress?
Stock-Markets / Stocks Bear Market May 26, 2016 - 11:01 AM GMTBy: Chris_Vermeulen

 The SPX topped out one year ago, on May 20th, 2015 at 2134.72. One year has gone by in the SPX and has still not made a new high. It could be many years before we breach that high!
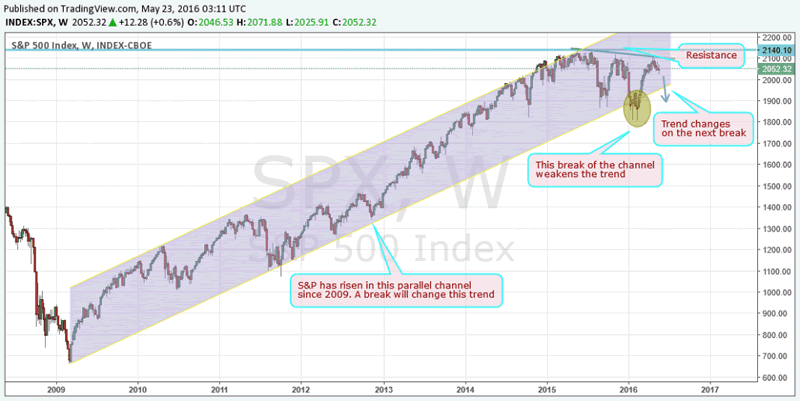
The SPX chart below indicates why it is not making any new highs and why a trend change is due any day, now!
From the lows of 2009, the SPX has risen in a parallel channel while never breaking/closing below it with the exception of the beginning of this year at which time it broke down the channel and then closed below it. However, it has since recovered, as indicated in the chart below, however, it is facing significant overhead resistance in the 2110 levels.
There is a lower high formation during all of the pullbacks, after the corrections, as can be viewed, in the chart below.
Whenever a long trending channel is broken, it weakens and the odds of a breakdown increases. The next move is the break of the channel which will change the uptrend into a downtrend.
Allow me to analyze what the targets of the long-term break of the uptrend are.
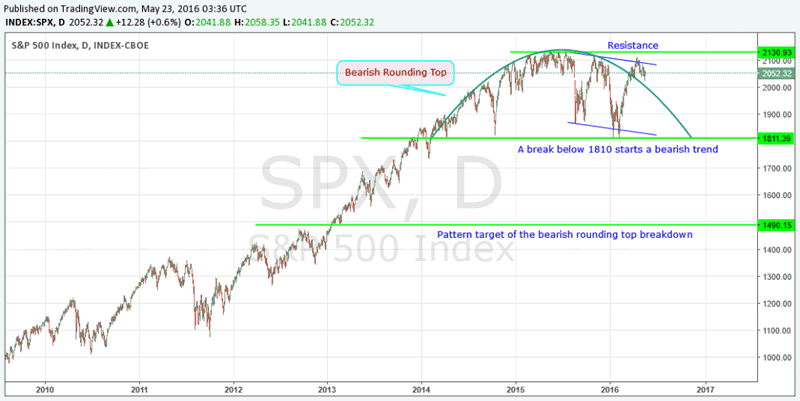
The pattern breakdown becomes confirmed below the 1810 levels. The break will form a pattern target of 1490 on the SPX. The targets usually overshoot in a bearish market, therefore,1490 is merely a ballpark figure that the markets can go much lower while falling.
Along with breakdown of the channel, the SPX is also making a long-term bearish rounding pattern as indicated, in the chart below.
The long-term chart patterns are negative, however, unless the shorter time- frame also becomes negative, a buy or a sell signal is not triggered.
Let’s see what the short-term time frame chart patterns are suggesting!
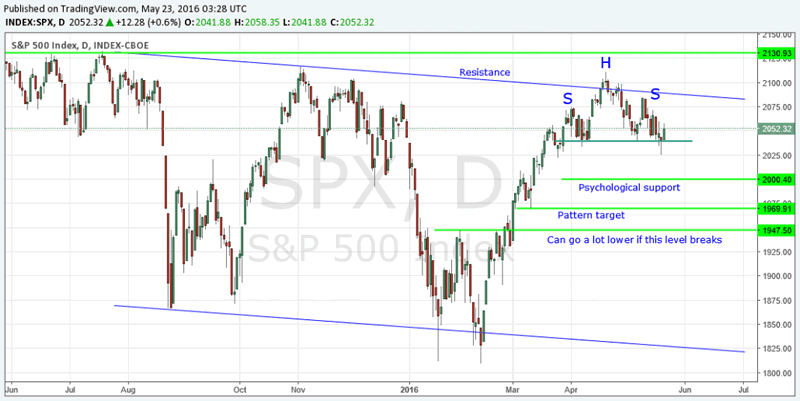
The short-term pattern shows a classic ‘textbook’ example of a bearish head and shoulder pattern as depicted in the next chart below.
The pattern will be confirmed when the SPX breaks and closes below the neckline at 2040.
Below the 2040 level, the next support level comes in at the psychological 2000 level. Most traders who have been buying the dips will buy close to this level, and I expect to see a bounce.
The professional traders will use any bounce off these levels to short the market, to take advantage of it’s long awaited downtrend.
The bearish head and shoulder pattern target, on the lower end is located at the 1970 levels. However, these targets are only a rough levels for reference. The markets can easily overshoot these levels.
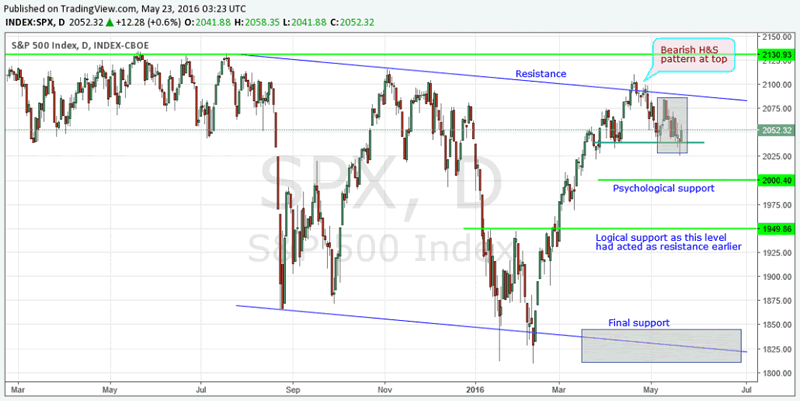
On the shorter time frame, there are various levels which can offer support during the next major decline.
As explained above, the 2000 level is a ‘psychological support area’ and 1970 is the pattern target. However, upon studying the charts, I can see that 1950 levels, which had earlier acted as a resistance, will now offer support.
If the markets break below the 1950 levels, then there is no support until it drops to the lows of 1810. Once the SPX breaks below the 1810 levels, it will enter into its’ multi-year bearish trend decline. The markets do not honor any support levels once it enters a confirmed bearish trend! Hence, although 1490 is the target, markets can go much lower as long as the bearish trend continues.
I have provided all of the important levels which you should watch out for.
However, no pattern plays out exactly the way we expect it should, hence, it is important that you keep watching my daily morning video forecasts, as I will keep updating new breaking market trade set-ups, to subscribers.
This way you will see the latest changes on the charts and the accompanying action to be taken. Continue watching and be prepared to engage in this market, at the right time via my ETF trade alerts.
My cutting edge analysis will reveal all of the new twists and turns in all of the markets in which all of the big investment houses trade.
Get My Daily Video Forecasts & Alerts: www.TheGoldAndOilGuy.com
Chris Vermeulen
Join my email list FREE and get my next article which I will show you about a major opportunity in bonds and a rate spike – www.GoldAndOilGuy.com
Chris Vermeulen is Founder of the popular trading site TheGoldAndOilGuy.com. There he shares his highly successful, low-risk trading method. For 7 years Chris has been a leader in teaching others to skillfully trade in gold, oil, and silver in both bull and bear markets. Subscribers to his service depend on Chris' uniquely consistent investment opportunities that carry exceptionally low risk and high return.
Disclaimer: Nothing in this report should be construed as a solicitation to buy or sell any securities mentioned. Technical Traders Ltd., its owners and the author of this report are not registered broker-dealers or financial advisors. Before investing in any securities, you should consult with your financial advisor and a registered broker-dealer. Never make an investment based solely on what you read in an online or printed report, including this report, especially if the investment involves a small, thinly-traded company that isn’t well known. Technical Traders Ltd. and the author of this report has been paid by Cardiff Energy Corp. In addition, the author owns shares of Cardiff Energy Corp. and would also benefit from volume and price appreciation of its stock. The information provided here within should not be construed as a financial analysis but rather as an advertisement. The author’s views and opinions regarding the companies featured in reports are his own views and are based on information that he has researched independently and has received, which the author assumes to be reliable. Technical Traders Ltd. and the author of this report do not guarantee the accuracy, completeness, or usefulness of any content of this report, nor its fitness for any particular purpose. Lastly, the author does not guarantee that any of the companies mentioned in the reports will perform as expected, and any comparisons made to other companies may not be valid or come into effect.
Chris Vermeulen Archive |
© 2005-2022 http://www.MarketOracle.co.uk - The Market Oracle is a FREE Daily Financial Markets Analysis & Forecasting online publication.