Statistically Significant Stock Market Death Cross?
Stock-Markets / Stock Markets 2016 May 18, 2016 - 03:12 PM GMTBy: Ashraf_Laidi
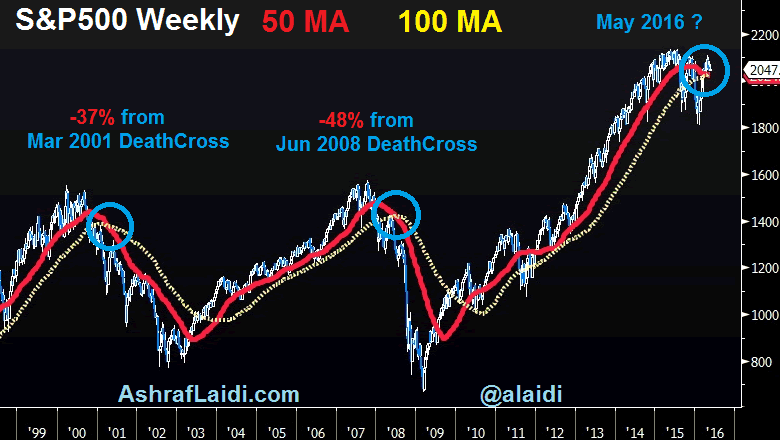
 Will skeptics and backers of Death Cross finally unite? The S&P500 is currently showing a pattern seen in June 2008 and March 2001, both cases in which the index lost more than 30%. The 50-week moving average is crossing below the 100-week moving average, a pattern whose importance has been highlighted by its rarity and consequence.
The chart below shows the June 2008 weekly 55-100 Death Cross was followed by a 48% decline in the S&P500, while the March 2001 weekly 55-100 DC was followed by a 37% drop.

Equally significant - and addressing a typical criticism of Death Crosses in that they often occur after the bulk of the move had been played out) -- both of the March 2001 and June 2008 DC emerged after the market had already fallen 29% and 19% off its peak respectively.
Applying the pattern to today's markets, equity indices appear significantly more stable than in 2001 and 2008, with the index off its highs by no more than 5%.
Yet, how do we relate the fact that stocks have not yet their highs in 12 months, the longest period without a new record since the 5 years elapsing between 2007 and early 2013.
May 21st marks the 1-year anniversary of the stock market high (SPX record was on May 21st, Dow record on May 22nd). 12 months without a new high in equity indices is the longest since the 5 years and 5 months (from the Oct 2007 high to the March 2013 high). Interestingly, the 2013 high emerged on the heels of the Fed's announcement of QE3 two months earlier.
The Fed's efforts to convince markets that a second rate hike is viable are increasingly being ignored by FX and bond markets, while equities remain tied to a triangular correlation, which spells more slow pain for risk appetite, higher volatility, steady yen and weak yields.
Jobs are the last to know
One point worth noting, often repeated in my tweets is that labour markets may be a lagging indicator and not a leading sign of economic growth. As firms retrench, they usually start with capex reduction (trilling R&D, technology, opening new markets etc), holding more cash, adding to retained earnings-- only then they pullback from hiring before eventually laying off workers. Thus, the divergence between weak economic activity and robust employment may soon come to an end.
Fed's Inflation-Employment Considerations
The big debate inside the Fed remains whether the US economy has reached or is nearing full employment, also known as non-acceleration inflation rate of unemployment (NAIRU), the rate at which inflation risks pushing higher, or in today's environment, the rate below, which it is difficult to further cut unemployment without stoking inflation.
The problem is that with core PCE price index (Fed's preferred inflation gauge) dropping back to 1.6% y/y in March from 1.7%, inflation may return near the Fed's 2.0% target. Other measures of inflation (driven by bond market expectations) have stalled at 1.64% late last month, the highest seen since July 2015. Fed members in Yellen's camp have long expressed the importance of not rushing with additional rate hikes before seeing: i) more adequate and (durable) signs of improved inflation and ii) prolonged tightness in labour markets. At this point, both factors require further improvement, while foreign risks need to be kept at bay in order for the Fed to move.
The aforementioned inflation/jobs dynamics are most crucial for reading the Fed's intentions. But let's not also forget the broadening weakness in US macro indicators and the most recent growth figures showing Q1 GDP at 0.5%, the lowest in 2 years.
The probability of Fed June hike has now fallen to 2% from 10% prior the reports' release. Stocks have peaked nearly 3 weeks ago after a 16% rally driven mostly by stock-buybacks, easily-beaten expectations in a lowering-of-standards earnings season and stabilizing global economic conditions (lower USD, lower yields, falling volatility).
Looking ahead
The positive correlation between equity indices, G10-yields & USDJPY could well be here to stay despite temporary disruptions. Japanese investors continue to hedge their FX exposure of their foreign-bound holdings for fear of yen gains and the BoJ will not expand QE via JGBs because there are simply not enough bonds to be bought; equities are gradually moving from will take a bigger notice of the macro-economic challenges (bottoming unemployment/jobless claims, bottoming in cost-cutting & lack of material gains in capex) and; yields reflect a low growth-low inflation environment.
By Ashraf Laidi
AshrafLaidi.com
Ashraf Laidi CEO of Intermarket Strategy and is the author of "Currency Trading and Intermarket Analysis: How to Profit from the Shifting Currents in Global Markets" Wiley Trading.
This publication is intended to be used for information purposes only and does not constitute investment advice.
Copyright © 2016 Ashraf Laidi
Ashraf Laidi Archive |
© 2005-2022 http://www.MarketOracle.co.uk - The Market Oracle is a FREE Daily Financial Markets Analysis & Forecasting online publication.


