


Gold, Silver and the Stock Market
Commodities / Gold and Silver 2016 May 13, 2016 - 02:15 PM GMTBy: Gary_Tanashian

 I could write a long, detailed post trying to encompass global stock markets (generally bearish), commodities (bounce very mature) and bonds (mixed views, depending upon the flavor) but that is what I get paid to do each weekend in NFTRH reports and in private posts at the site. The beauty of public posts is that I can write as much or as little as I feel like writing. Today I feel like writing a little about gold (and silver) and the stock market. I also feel like using daily charts because I think time frames are pinching in for upcoming pivotal moves.
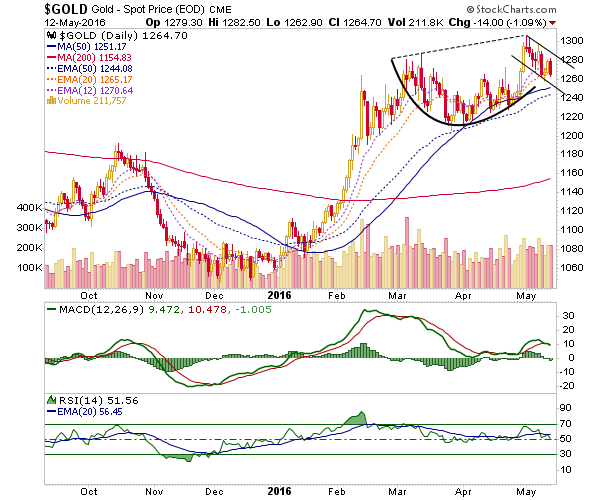
Gold is in a rather orderly Handle to a short-term Cup & Handle. Personally, I think gold and the precious metals complex need a correction because [insert CoT, Sentiment and over bought reasoning here]… But the chart thinks otherwise. If the Handle breaks upward and gold exceeds 1300, the measured target is to around 1370. It if goes the other way, watch for support beginning at the October high of 1191 down to 1180, figuring for wiggle room.
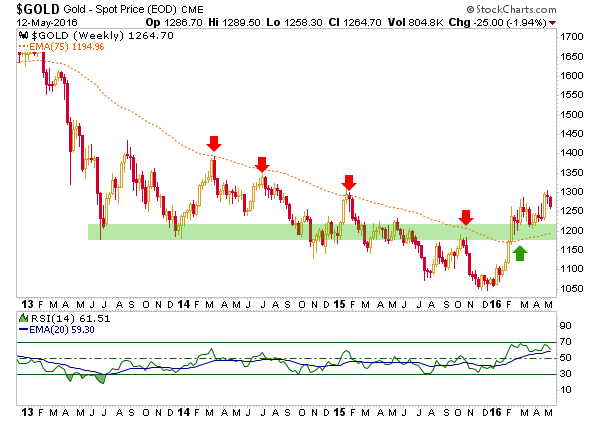
The weekly chart’s EMA 75, the former bear market shackle, agrees with that support.
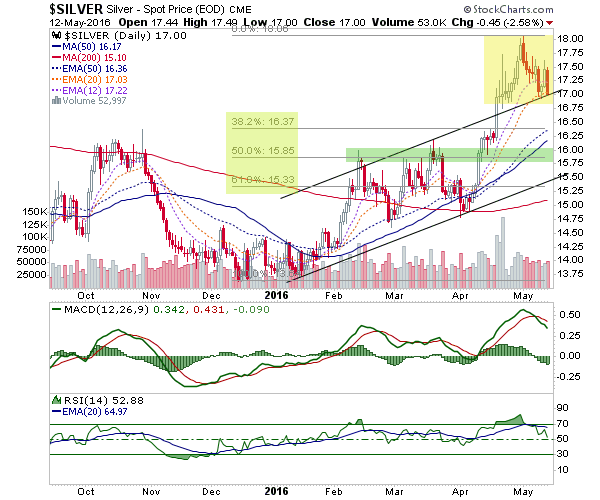
Silver… if it looks like a short-term top and it quacks like a short-term top, is it a short-term top? If it is then the best support looks to be the 50% Fib retrace at 15.85.
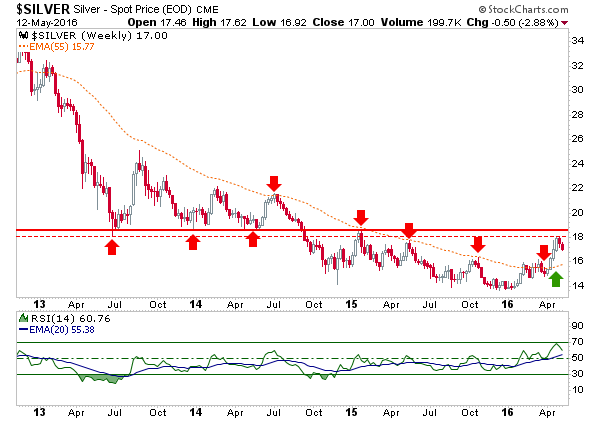
Silver weekly shows the former bear market ball and chain as the EMA 55 at 15.77. Close enough to the 50% Fib to be in agreement on the general support area.
Silver would need to break below the daily chart’s EMA 20 (and the top channel line) to indicate that a correction is on. So far it is clinging to support. If that is given up, watch for the mid/high 15’s as a correction target.
The Gold-Silver ratio continues to show a bottoming stance after hitting deeply over sold levels. I like to use Silver-Gold when projecting a beneficial asset market environment and I like to flip it over to Gold-Silver when projecting a dangerous one. Well, it is flipped over…
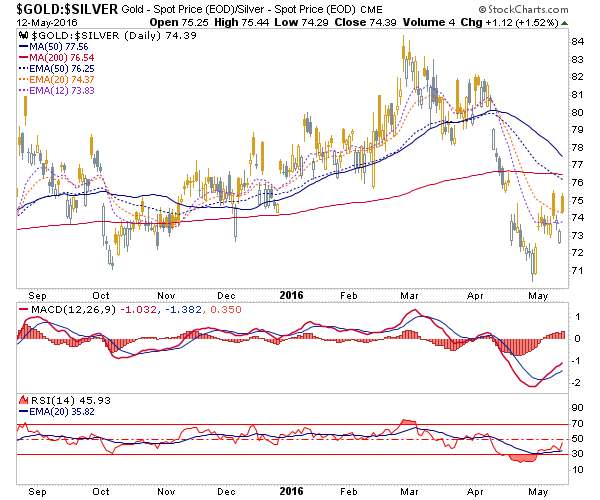
Taking it a step further, a rising Gold-Silver ratio often goes with a rising US dollar, as liquidity comes out of markets. As bearish as Uncle Buck is on its intermediate trend, there is further short-term bounce potential, especially if the Gold-Silver ratio is bottoming.
This would not bode well for a stock market living on inflation expectations, because it sure is not living on corporate profit acceleration or guidance, apprehensive market sentiment or technical events like a higher high to October, close though it came. If the 50 day moving averages give out, look lower on the S&P 500, which is already losing momentum by MACD and RSI. The next stop could be at around the 2000 round number with further bearish probabilities if the SMA 200 were to give way.

If somehow silver reverses back upward to lead gold and the ‘inflation trade’ (including stocks) higher, it’s ‘party on, Garth’. But that is not the way things are pointing at this moment in time.
Gold is the first mover to new inflationary environments and silver is the best mover when it gets going and takes over leadership. Silver has led since mid-February (as noted in this post) and wouldn’t you know it, the stock market has rallied since then. But now silver’s leadership is in question.
Subscribe to NFTRH Premium for your 25-35 page weekly report, interim updates (including Key ETF charts) and NFTRH+ chart and trade ideas or the free eLetter for an introduction to our work. Or simply keep up to date with plenty of public content at NFTRH.com and Biiwii.com.
By Gary Tanashian
© 2016 Copyright Gary Tanashian - All Rights Reserved
Disclaimer: The above is a matter of opinion provided for general information purposes only and is not intended as investment advice. Information and analysis above are derived from sources and utilising methods believed to be reliable, but we cannot accept responsibility for any losses you may incur as a result of this analysis. Individuals should consult with their personal financial advisors.
Gary Tanashian Archive |
© 2005-2022 http://www.MarketOracle.co.uk - The Market Oracle is a FREE Daily Financial Markets Analysis & Forecasting online publication.