Markets At Crossroads: Huge Moves Brewing In Stocks And Gold
Stock-Markets / Financial Markets 2016 May 06, 2016 - 11:29 AM GMTBy: InvestingHaven
 Markets arrived at crossroads, and big moves are around the corner.
Seldom have we seen so many assets and indicators at decision points simultaneously! We see stocks, gold, and the U.S. dollar trading at extremely important levels, all in conjunction. Note that this is not according to technical analysis, but our intermarket analysis and chart patterns.
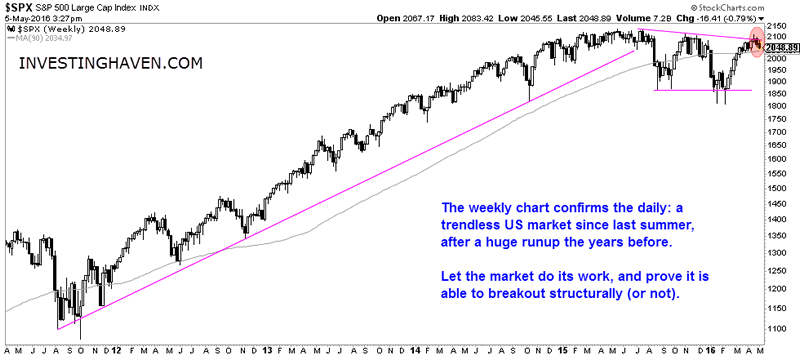
First, as indicated in recent analysis, risk indicators in U.S. stocks have turned positive in recent weeks. That suggest a bullish outcome for stocks, almost exactly at their breakout level. We prefer to let the market do its work, and so far we have not seen a breakout. But there are sufficient signs that it is in the making.
As stocks are testing key resistance, the U.S. dollar is testing secular support. Needless to say that the next chart is of incredible importance to all markets worldwide. Remember the summer of 2014, when the dollar started a huge rally? It created a domino effect in all markets: crude oil crashed with more than 70% (its steepest decline ever), stock markets went through a flash crash, emerging markets collapsed, … If the dollar manages to hold the 92 level, it would imply a successful test of its secular breakout. We should not understimate the importance of this scenario, as the dollar would be in a confirmed bull market, or, at a minimum, in a consolidation phase of its bull market.
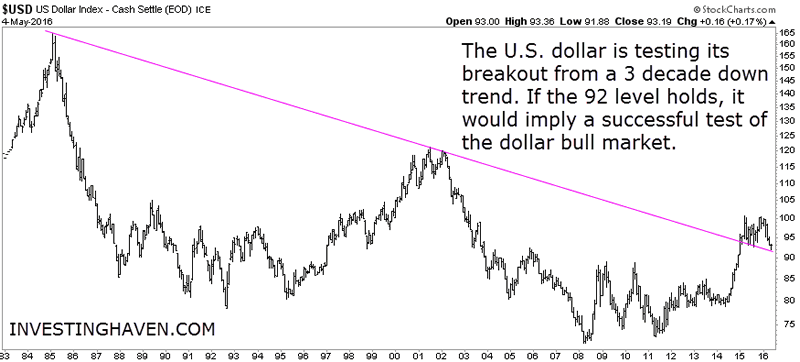
We realize that a dollar bull market is not in line with the expectations of many, including ourselves. Let us reiterate, just like we did repeatedly in the past, that we are not hoping for that outcome. We do not believe that ongoing extreme monetary policies will end well, and the sooner a correction in monetary markets takes place, the better. Our job, however, is to read the message of markets, regardless our opinion(s). So our analysis is objective, and we simply look for trends and try to derive as much as possible valuable information on the charts.
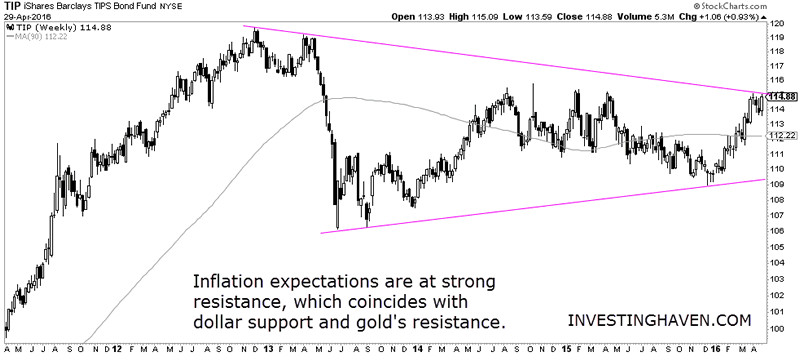
Talking about expectations, below is the chart featuring inflation expectations. This is another case of an asset that reached multi-year resistance.
While all previous charts were interesting and meaningful, the most fascinating chart currently is GOLD. This is an incredible story. The yellow metal moved from the bottom of its descending trend channel to the top in a matter of weeks. That was an extremely powerful move, and we admit in all honesty that we did not see that coming.
However, gold is being stopped currently, and seems not able to rally any further. Gold’s huge resistance area coincides with secular support in the U.S. dollar, resistance in inflation expectations, and critical resistance in U.S. stocks. That is really no coincidence. From an intermarket point of view, this is an extremely important period of time, as the next big moves are brewing, and we can expect a resolution sooner rather than later.
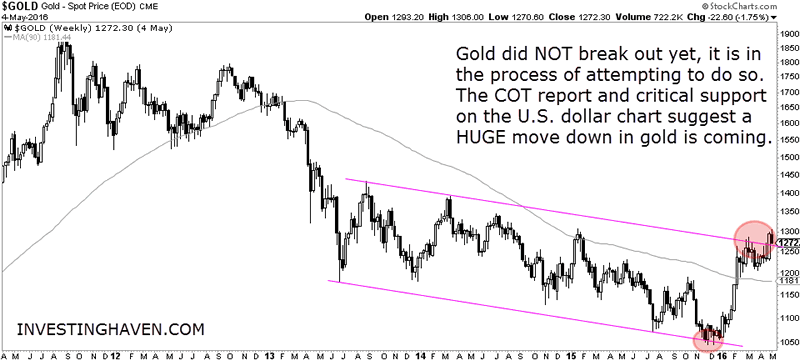
Which direction will gold go? We believe the rally in gold is over, and a sharp correction is in the making, based on two indicators.
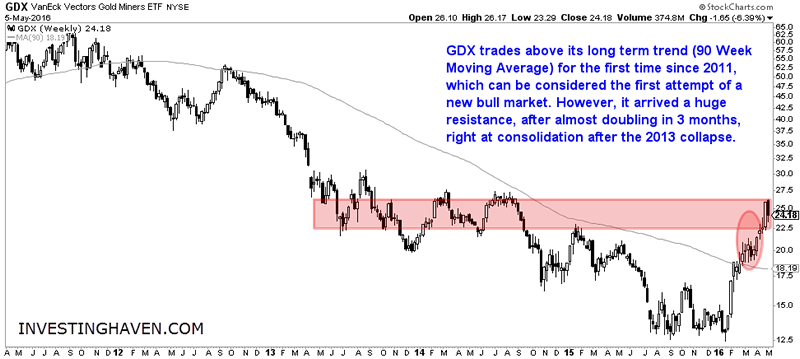
First, gold miners, a leading indicator in the precious metals complex, have reached extreme resistance. Note on the next chart how the current resistance level goes back to the 2013 collapse. After the incredible recent run in which gold miners doubled in a matter of weeks, the rally seems extremely overbought currently, and we see a sharp reversal right at the upper boundaries of resistance. This is extremely bearish.
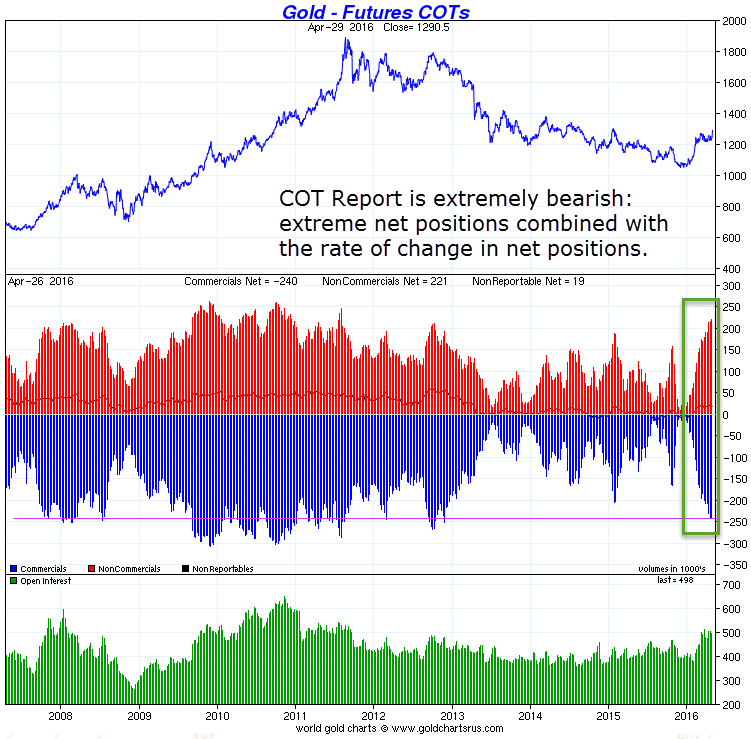
Our second, and more important, indicator in precious metals is the COT report. Readers know meantime that we are focused on the combination of extreme net positions of commercial traders and the rate of change of their net positions. Both paramaters suggest an extremely bearish scenario. Commercial traders have accumulated short positions in a very fast way (too fast), and reached extreme levels not seen since December 2012, right before the big crash of precious metals.
Are we now saying that a crash is coming in gold and silver, similar to 2013? Not necessarily, but our point is that a severe correction is in the making, and we do not exclude that gold will fall back to the lower area of its trend channel, which would be right above $1,000, based on the extremely bearish COT report.
CONCLUSION:
We believe gold is about to correct sharply very soon. The U.S. dollar is testing its secular breakout point, watch whether the 92 level holds for a breakdown or a confirmation of its bull market. Depending on the move of the U.S. dollar stabilizes, we will see consequences in global markets: a stabilization of the dollar could push stocks much higher, a break down of the dollar (very unlikely though) will lit a fire under commodities markets, while a successful retest of the dollar’s breakout level will result in a strong correction in commodities and gold.
Reserve your free seat for our upcoming live webinars: How To Survive And Thrive In Today’s Difficult Market and How To Include Central Banks And Monetary Policies In Your Investment Strategy.
Upcoming webinar "Survive and thrive in today's difficult market" (subscribe for free) >> Upcoming webinar "How to include central banks in your investment strategy" (subscribe for free) >>Analyst Team
The team has +15 years of experience in global markets. Their methodology is unique and effective, yet easy to understand; it is based on chart analysis combined with intermarket / fundamental / sentiment analysis. The work of the team appeared on major financial outlets like FinancialSense, SeekingAlpha, MarketWatch, ...
Copyright © 2016 Investing Haven - All Rights Reserved Disclaimer: The above is a matter of opinion provided for general information purposes only and is not intended as investment advice. Information and analysis above are derived from sources and utilising methods believed to be reliable, but we cannot accept responsibility for any losses you may incur as a result of this analysis. Individuals should consult with their personal financial advisors.
© 2005-2022 http://www.MarketOracle.co.uk - The Market Oracle is a FREE Daily Financial Markets Analysis & Forecasting online publication.


