Fear Not Gold Bugs, Gold Ratios Well Intact
Commodities / Gold and Silver 2016 May 04, 2016 - 04:55 PM GMTBy: Gary_Tanashian
 What has been going on since mid-February is a burst of the ‘inflation trade’ as evidenced by silver’s leadership in the precious metals sector. This opened the barn door for all kinds of inflated animals to flee into the light of day, and for commodity and inflation boosters to do their thing. As often happens with silver, things were pushed to and even through their limits. Silver went up, oil went up, base metals went up and stocks went up.
But what we should do is retire back to some of the things that actually indicated bullish for the gold sector well before the mini hysteria (and market relief) cropped up. A pullback/correction in gold stocks would be an opportunity.
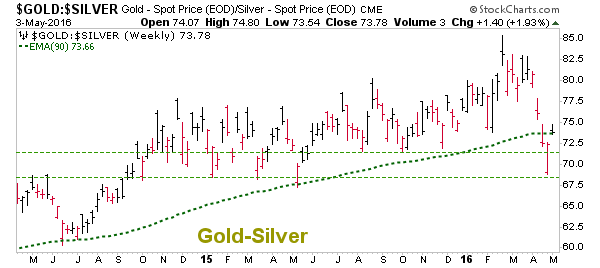
Gold vs. Silver took a real hit and now is bouncing, unsurprisingly as USD makes a final support bounce attempt of its own.
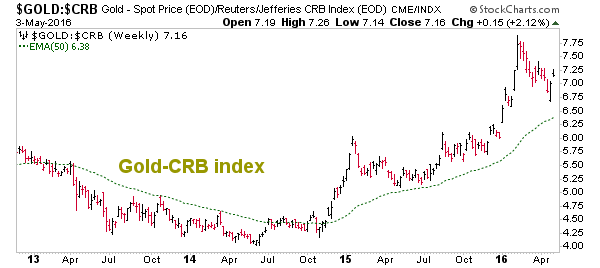
Gold vs. Commodities has been in consolidation and could be breaking the bull flag.
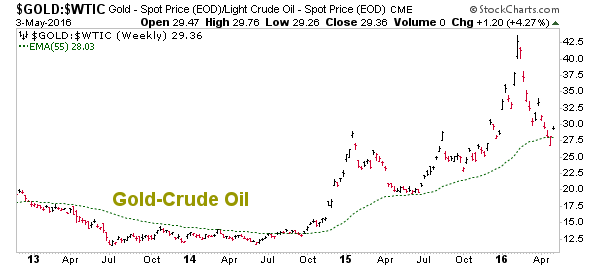
Gold vs. Crude Oil got drubbed of late but remains in a big picture uptrend.
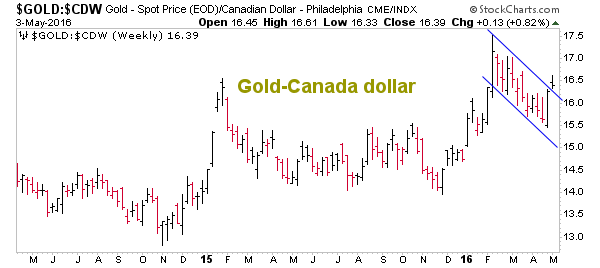
Gold vs. ‘commodity currency’ CDW is breaking up from a bull flag (a Handle to a Cup and Handle).
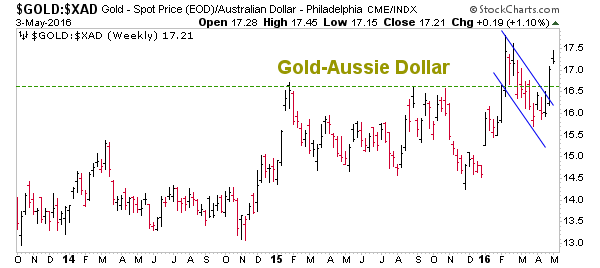
Gold vs. ‘commodity currency’ XAD is also breaking upward from a bull flag.
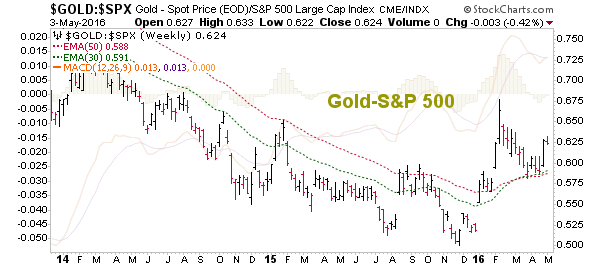
Gold vs. S&P 500 remains bullish and possibly breaking consolidation. The stock market is down in pre-market and so is gold? What is the meaning of this?!? The meaning is that gold pumped with all the other stuff recently and so some of that stink will stick to it in the short-term.
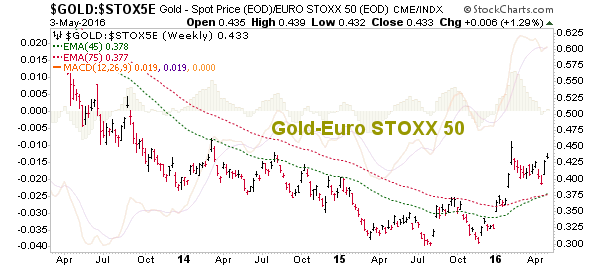
Gold vs. Euro STOXX 50 is still very bullish.
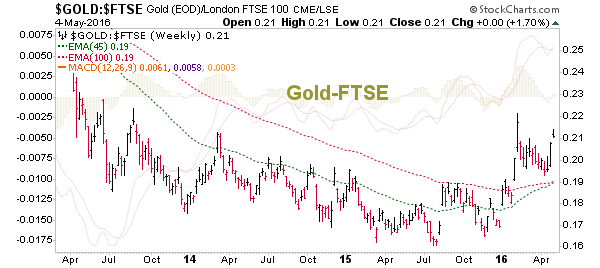
Gold vs. London is very bullish.
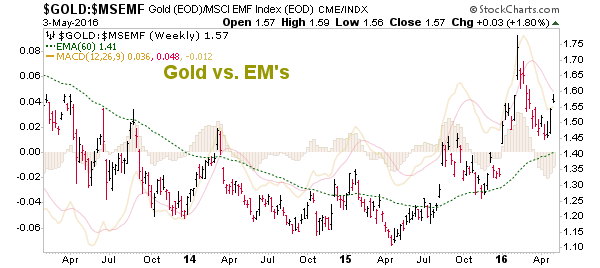
Gold vs. Emerging is bullish and starting to break consolidation.
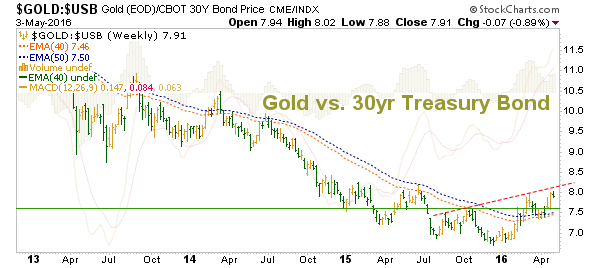
Finally, Gold vs. Long-term US Treasury Bonds is still very constructive off the bottom in an upward tilting inverted H&S pattern above the moving averages. This one is a view of the risk ‘off’ hard asset compared to the risk ‘off’ paper debt instrument subject to government borrowing/spending and Federal Reserve policy machinations. So, it’s a confidence indicator.
Subscribe to NFTRH Premium for your 25-35 page weekly report, interim updates (including Key ETF charts) and NFTRH+ chart and trade ideas or the free eLetter for an introduction to our work. Or simply keep up to date with plenty of public content at NFTRH.com and Biiwii.com.
By Gary Tanashian
© 2016 Copyright Gary Tanashian - All Rights Reserved
Disclaimer: The above is a matter of opinion provided for general information purposes only and is not intended as investment advice. Information and analysis above are derived from sources and utilising methods believed to be reliable, but we cannot accept responsibility for any losses you may incur as a result of this analysis. Individuals should consult with their personal financial advisors.
Gary Tanashian Archive |
© 2005-2022 http://www.MarketOracle.co.uk - The Market Oracle is a FREE Daily Financial Markets Analysis & Forecasting online publication.


