


US House Prices Outpacing Official Inflation Rate, Household Income
Housing-Market / US Housing May 02, 2016 - 04:07 PM GMTBy: MISES

 Ryan McMaken writes: This week, the latest numbers from the S&P/Case-Shiller index showed continued significant home price growth in most of the 20 cities within the survey. The cities with the most growth were found in the Western US and, to a lesser extent, the South:
According to the report:
"Home prices continue to rise twice as fast as inflation, but the pace is easing off in the most recent numbers," David M. Blitzer, chairman of the Index Committee at S&P Dow Jones Indices, said in a statement. "The year-over-year figures for the 10-city and 20-city composites both slowed, and 13 of the 20 cities saw slower year-over-year numbers compared to last month."
While numbers have moderated over the past year, many cities continue to see sizable growth:
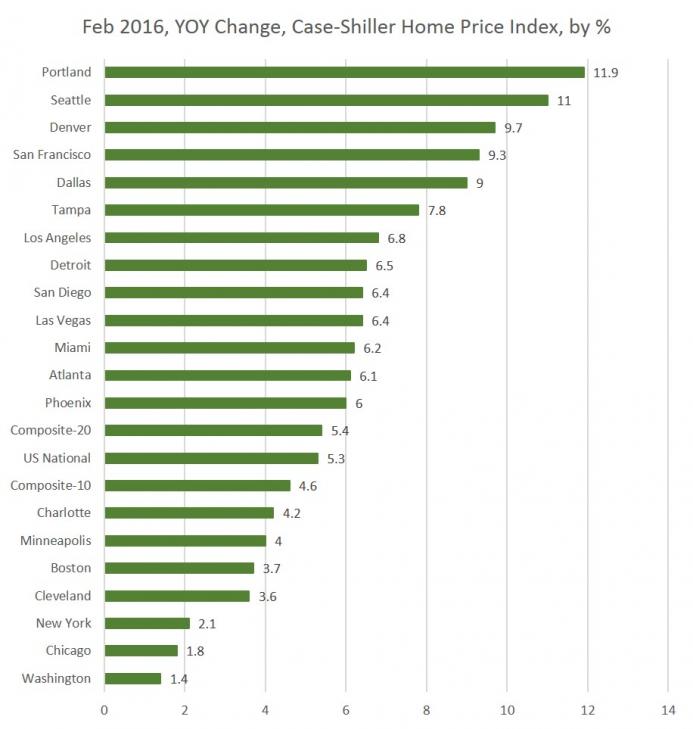
Part of this dichotomy between the West and north is due to larger demographic trends, as discussed in this article. More people are moving west and south.
But the growth seen here is also due to the fact that the US is still in the boom part of the business cycle. Credit is still easy to come by for those with income. And job growth, though very anemic (see here) remains stable.
Moreover, the Case-Shiller index deals primarily with single-family homes, and single-family home production has never returned to where it was prior to 2008.
If we take this all together, we can start to see how the boom in home prices is different than the last one. Job growth and wage growth is weaker (where there is real growth at all), and housing production is much lower than it was during the last cycle.
In other words, while we may be in a boom phase, this one is weaker than the last one.
In fact, looking at home price growth according to this index, we find year-over-year growth rates in this cycle have never matched where they were in 2005 and 2006. I've also compared the C-S index growth to year-over-year growth in the CPI to get a better sense of real home price growth:
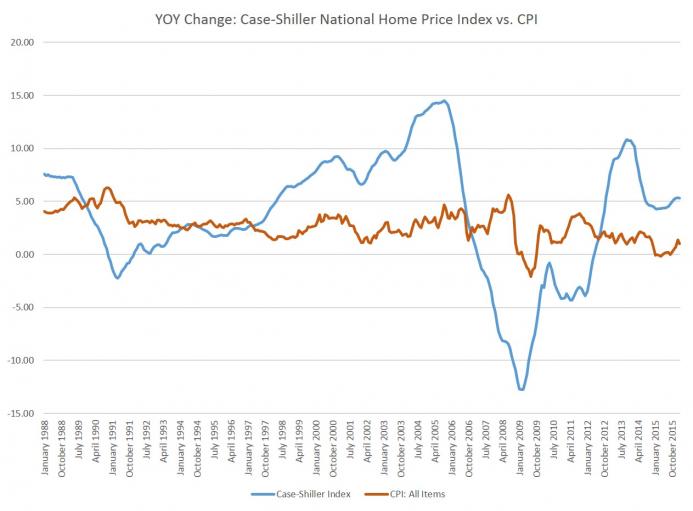
Here we can identify a few different periods. During the first half of the 1990's, home price growth according to this measure was more or less flat. It was only after 1997 that we really began to see the growth we have later associated with the dot-com boom.
That boom was never allowed to collapse, though, thanks to massive monetary and fiscal stimulus in the early Bush years which led to the bubble years of the mid-2000s. After that, home prices came in well below the official inflation rate. Again, after 2012, home prices came roaring back following both fiscal stimulus (remember all those first-time home buyer programs 5 years ago?) and monetary stimulus with the target Federal Funds Rate at record low levels.
Since 2012, though, thanks to both a deflationary economy and a lack of any additional room for action on the part of the Fed, home price growth nationwide has dipped well below even the peak of this current cycle. Most cities are now in the 3-percent to 6-percent range.
Given that the official inflation rate is coming in around one- to two-percent growth, the CPI isn't realistically accounting for the realities of true essentials — i.e., not iPads — such as housing prices, especially with rents outpacing home prices in many markets. Housing is the largest single living expense for most households, so six percent growth is a real challenge for households facing flat wages.
Needless to say, many prospective first-time home buyers in places like Portland and Seattle can pretty much forget about home purchases if current trends continue, and unless wage growth picks up significantly. Wage growth is indeed relatively good in the much of the US, but few are seeing ten-percent growth in real income, year over year.
And speaking of income, how does it compare to home price growth?
Using the Census Bureau's single-year income estimates [xls file], I've compared income growth to the Case-Shiller growth (income is measured in current dollars):
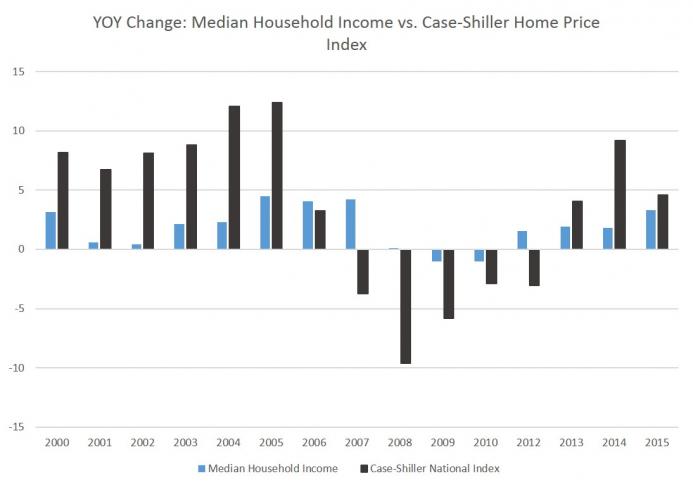
As one might expect, home price growth thoroughly outpaced wages from 2000 to 2005, although thanks in part to sticky wages and part time work, income growth did not fall like home prices fell from 2007 to 2012. But, for the past three years available (income numbers are as of March of the year listed), home prices have been outpacing income growth yet again.
For people who bought a home in 2000 (in the right neighborhood) and have bought and sold at the right times, this will not be a problem. However, household formation has continued unabated, so new households today looking to save money before buying a home will not be well-rewarded. With the Fed's war on saving, and low-risk investments (like savings accounts) paying at well under one percent, saving money the old-fashioned way is a rather useless endeavor. So, instead, we've replaced saving with consumer debt (i.e., mortgages) and a hope that people can continue to make the high payments every month. It's not a terribly wise long-term economic strategy, but it's one the Fed is banking on.
Ryan W. McMaken is the editor of Mises Daily and The Free MarketSend him mail. See Ryan McMaken's article archives.
You can subscribe to future articles by Ryan McMaken via this RSS feed.
© 2015 Copyright Ryan McMaken - All Rights Reserved Disclaimer: The above is a matter of opinion provided for general information purposes only and is not intended as investment advice. Information and analysis above are derived from sources and utilising methods believed to be reliable, but we cannot accept responsibility for any losses you may incur as a result of this analysis. Individuals should consult with their personal financial advisors.
© 2005-2022 http://www.MarketOracle.co.uk - The Market Oracle is a FREE Daily Financial Markets Analysis & Forecasting online publication.