


Stock Market Downtrend Should be Underway
Stock-Markets / Stock Markets 2016 Apr 30, 2016 - 10:34 AM GMTBy: Tony_Caldaro

 The market started the week at SPX 2092. On Monday the market pulled back to SPX 2072, rallied to 2097 on Tuesday, pulled back to 2082 ahead of the FOMC statement, then rallied to 2100 after it was released. On Thursday the market pulled back to SPX 2086, rallied to 2099, declined to 2052 on Friday and ended the week at 2065. For the week the SPX/DOW lost 1.25%, and the NDX/NAZ lost 2.80%. Economic reports for the week were generally positive. On the downtick: new home sales, consumer confidence/sentiment, the Chicago PMI and Q1 GDP was lower. On the uptick: durable goods, Case-Shiller, pending home sales, the PCE, personal income/spending, and the WLEI. Next week’s reports will be highlighted by the monthly Payrolls report and the ISMs.
LONG TERM: bear market
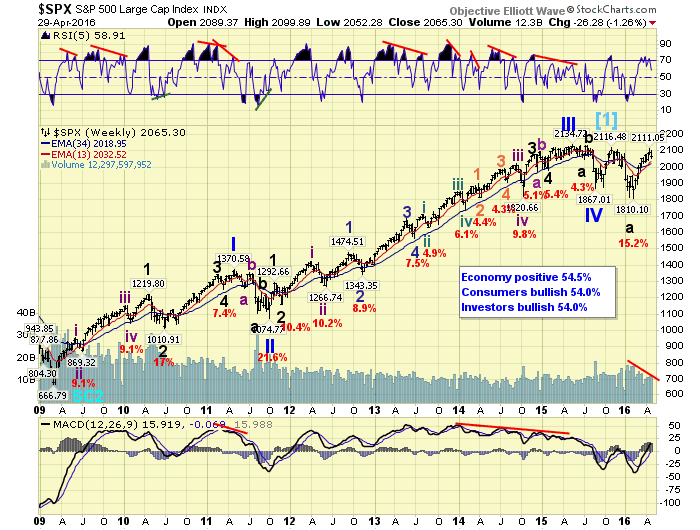
We continue to label the 2009-2015 as having completed last year in December, and a bear market now underway. During the first decline of the expected bear market the SPX lost 15% of it value and bottomed in mid-February. We labeled that Major wave A. The uptrend that followed has thus far also lasted two months until mid-April, and oddly enough retraced nearly all of the first decline. Since B waves sometimes do this sort of thing, and occasionally retrace more than the A wave decline, (an irregular B wave), the bear market call remains.
Since this strong uptrend has been driven by beaten down energy and commodity stocks, we took a look at the NDX which has neither of these sectors. The NDX made it absolute price high in December 2015, after five Primary waves up from early 2009 and a clear five wave Primary V. It then lost 18% during its first decline, which was clearly five waves down.
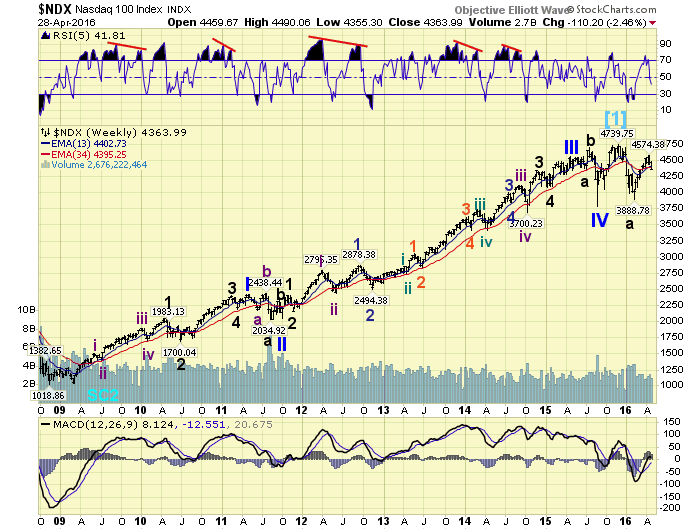
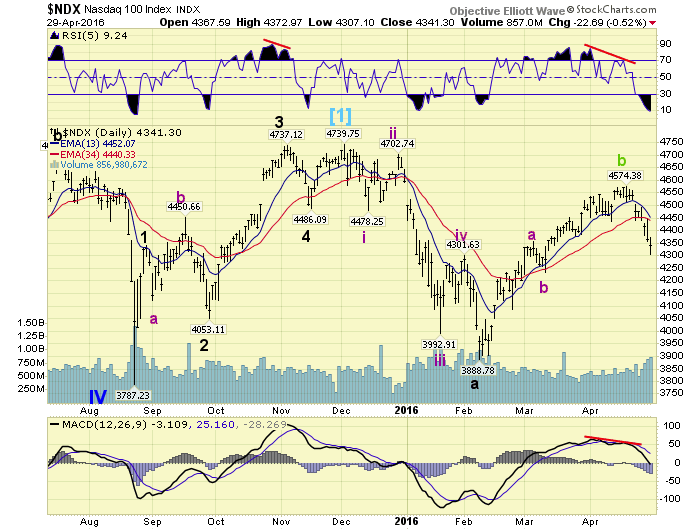
It then rallied along with the other three major indices until mid-April, when it came within 3.5% of its bull market high. After that high it has declined for the past eight days, losing 5.8% at Friday’s low, and is very close to confirming a new downtrend. Notice the negative divergences at the highs on the RSI and MACD.
The Nasdaq (NAZ) recently reached within 5% of its bull market high. Its recent decline of seven straight down days is not quite as bad as the NDX since it does have some energy/commodity stocks. Nevertheless it is quite close to confirming a downtrend too.
MEDIUM TERM: uptrend weakening
The current SPX uptrend, which started at 1810 in mid-February, continues to look corrective. We have counted eleven significant waves right into the SPX 2111 high, and the market confirmed the completion of the last wave by dropping below 2074 this week. We have been labeling this uptrend as Major wave B , with three Intermediate waves: a-b-c. At the high the RSI displayed a double negative divergence, like the one during the previous uptrend, and a negative divergence in the MACD. Quite similar to the NDX chart above.
Last weekend we noted three significant levels for this uptrend: 2111, 2074 and 2034. Exceeding the first would suggest the uptrend is extending, and still does. Breaking below SPX 2074 suggests the last five wave rally from 2034 completed, and it has. Breaking below SPX 2034 would suggest the uptrend has ended and a new downtrend is underway. And, it still does. Medium term support is now at the 2043 and 2019 pivots, with resistance at the 2070 and 2085 pivots.
SHORT TERM
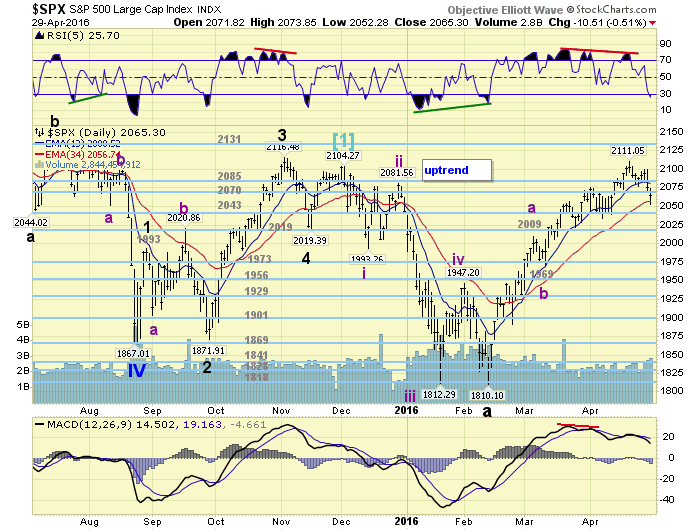
As noted above at the SPX 2111 we counted eleven corrective waves up from 1810. Nine waves and thirteen waves would be considered impulsive. We counted five overlapping waves up to SPX 2009 to complete Int. A: 1947-1891-1963-1932-2009. Then after a Int. wave B pullback, we counted another five overlapping waves to 2111: 2057-2022-2075-2034-2111.
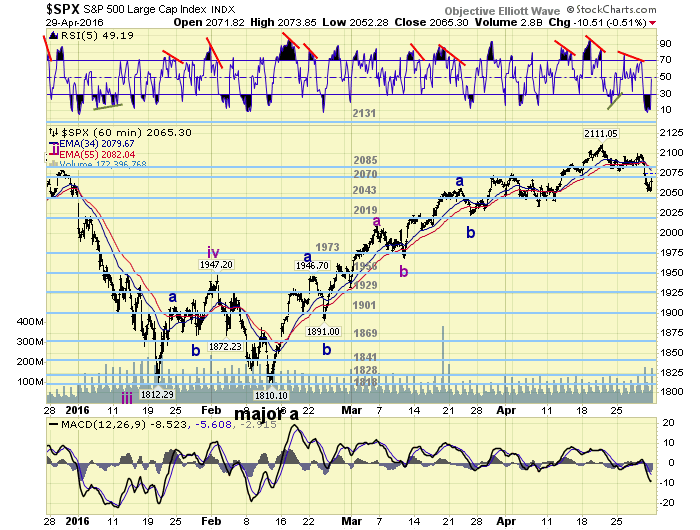
Since that high a week ago the market has declined 59 points for the largest decline since the uptrend began. The previous largest decline was 56 points back in February. At Friday’s low the hourly RSI hit its most oversold level of the entire uptrend. A level not seen since the last downtrend in the RSI and some other measures. Definitely some downside pressure has hit the market after weeks of a cruise control uptrend. Short term support is at the 2043 and 2019 pivots, with resistance at the 2070 and 2085 pivots. Short term momentum ended the week around neutral.
FOREIGN MARKETS
Asian markets were mostly lower on the week for a 1.9% loss.
European markets were all lower for a 2.4% loss.
The commodity equity group all rose for a 1.4% gain.
The DJ World index lost 0.70%.
COMMODITIES
Bonds are still in an uptrend and gained 0.4% on the week.
Crude continues to uptrend and gained 5.0%.
Gold hit new uptrend highs and gained 4.6%.
The USD hit new downtrend lows and lost 2.2% on the week.
NEXT WEEK
Monday: ISM manufacturing and Construction spending at 10am. Tuesday: Auto sales. Wednesday: the ADP, ISM services, Trade deficit and Factory orders. Thursday: weekly Jobless claims. Friday: Payrolls (est. +210K) and Consumer credit. Best to your weekend and week!
CHARTS: http://stockcharts.com/public/1269446/tenpp
After about 40 years of investing in the markets one learns that the markets are constantly changing, not only in price, but in what drives the markets. In the 1960s, the Nifty Fifty were the leaders of the stock market. In the 1970s, stock selection using Technical Analysis was important, as the market stayed with a trading range for the entire decade. In the 1980s, the market finally broke out of it doldrums, as the DOW broke through 1100 in 1982, and launched the greatest bull market on record.
Sharing is an important aspect of a life. Over 100 people have joined our group, from all walks of life, covering twenty three countries across the globe. It's been the most fun I have ever had in the market. Sharing uncommon knowledge, with investors. In hope of aiding them in finding their financial independence.
Copyright © 2016 Tony Caldaro - All Rights Reserved Disclaimer: The above is a matter of opinion provided for general information purposes only and is not intended as investment advice. Information and analysis above are derived from sources and utilising methods believed to be reliable, but we cannot accept responsibility for any losses you may incur as a result of this analysis. Individuals should consult with their personal financial advisors.
Tony Caldaro Archive |
© 2005-2022 http://www.MarketOracle.co.uk - The Market Oracle is a FREE Daily Financial Markets Analysis & Forecasting online publication.