


Stocks Bull or Bear Market Rally?
Stock-Markets / Stock Markets 2016 Apr 23, 2016 - 03:02 PM GMTBy: Tony_Caldaro

 The market started the week at SPX 2081. On Monday it dipped down to SPX 2074 and then started to rally to new uptrend highs. By late Wednesday the SPX hit 2111, and then started to decline. By Friday morning the SPX hit 2081, then bounced to end the week at 2092. For the week the SPX/DOW were +0.55%, the NDX/NAZ were -1.10%, and the DJ World index gained 0.70%. Economic reports for the week were mostly positive. On the downtick: building permits, housing starts and the Philly FED. On the uptick: existing home sales, the FHFA index, leading indicators, the WLEI and weekly jobless claims improved. Next week’s reports will be highlighted by the FOMC meeting, Q1 GDP and the PCE. Best to your weekend and week!
LONG TERM: bear market rally
After a two month uptrend, and the SPX reaching within 1% of its all time high, it has become increasingly difficult to find bearish pundits anywhere. Even many of the perm-bears, as they are called, have turned bullish. This uptrend has obviously become quite a convincing, the central banks have got your back, advance. Nevertheless, we would like to point out the MACD activity on the monthly chart below. As you will observe it topped out in early 2015 and has been heading lower ever since, except for some flattening out in the first few months of 2016. This is not bull market action.
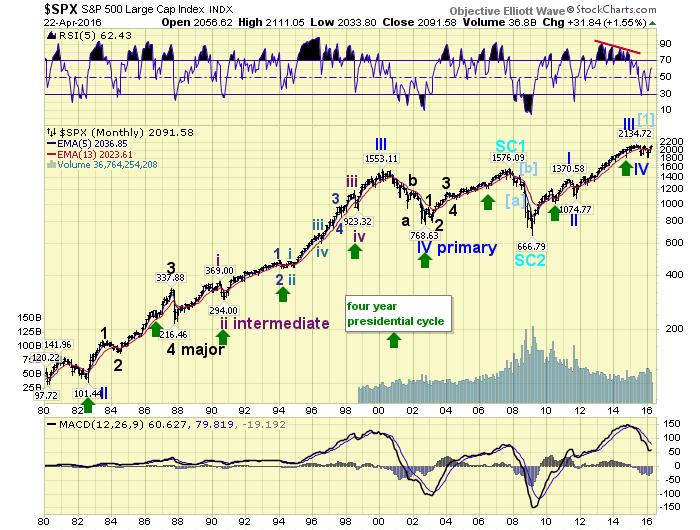
Notice the MACD peaked before price in 2007 and declined throughout the bear market that followed. Also observe the 1999 peak, and steady decline, except for a few flattening out periods during that bear market. A bit more difficult to observe is the 1987 peak and 1984 peak before the bear markets that followed.
We continue to count the Cycle wave [1] bull market completing in 2015 with five Primary waves. Primary waves I and II completed in 2011, and Primary waves III, IV, V completed in 2015. The first decline from the Cycle wave [1] high we have labeled Major wave A. And the current uptrend is labeled Major wave B.
MEDIUM TERM: uptrend
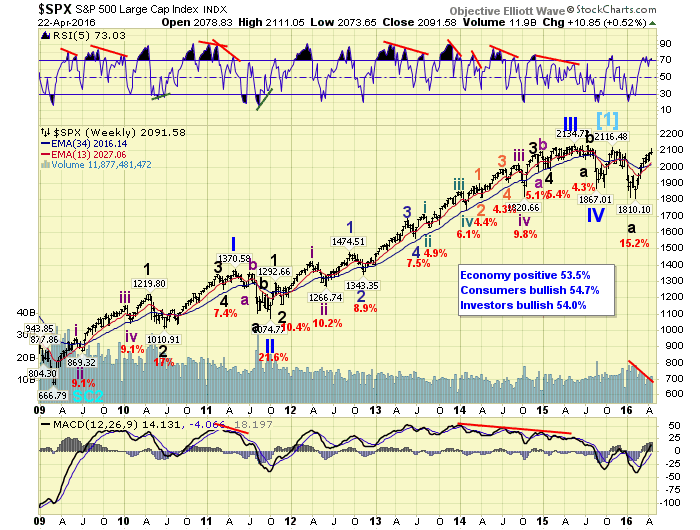
After a double bottom around SPX 1870 in late 2015 the market rallied straight up to SPX 2116 before faltering and heading back down again. After a double bottom around SPX 1810 in early 2016 the market has rallied straight up to SPX 2111. Both advances were two of the best uptrends in the past seven years, and both were preceded by double bottoms. At the SPX 2116 high the RSI displayed a double negative divergence. At the recent SPX 2111 high the RSI is displaying a double negative divergence. The initial decline, after the SPX 2116 high, started off gradually and then gained momentum on the way down. The recent SPX 2111 high only occurred two days ago.
We continue to label this uptrend as three Intermediate waves. Int. A at SPX 2009, Int. B at SPX 1969, and Int. C at SPX 2111. We have counted Int. A as five overlapping waves: 1947-1891-1963-1932-2009. And Int. C as five overlapping waves: 2057-2022-2075-2034-2111. This pattern is currently suggesting an eleven wave complex zigzag. If the market has topped, a completed Major wave B would be in place. If it pulls back further and then rallies to higher highs, then it could start looking like an impulse wave. Either way, when this uptrend does conclude we will have a much better idea what this uptrend implies longer term. Medium term support is at the 2085 and 2070 pivots, with resistance at the 2131 pivot.
SHORT TERM
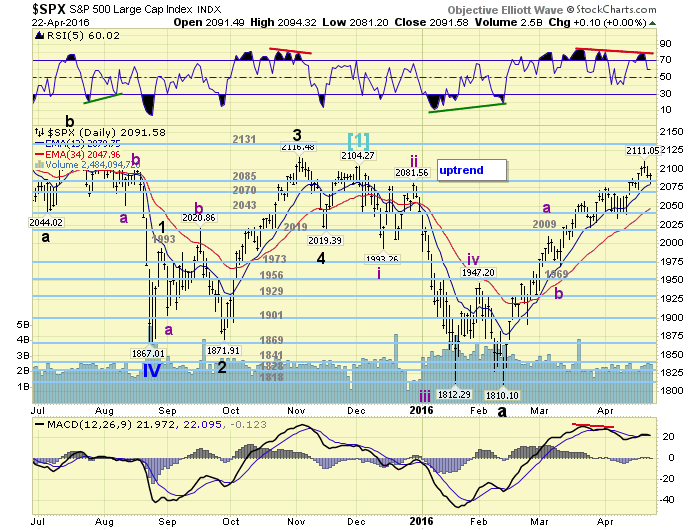
The short term wave pattern, as noted above, appears to be a series of five wave overlapping patterns. For Int. A we have Minor waves a and b at SPX 1947 and 1891, with a subdividing Minor c: 1963-1932-2009. Int. C has the same pattern: Minor waves a and b at SPX 2057 and 2022, with a subdividing Minor c: 2075-2034-2111.
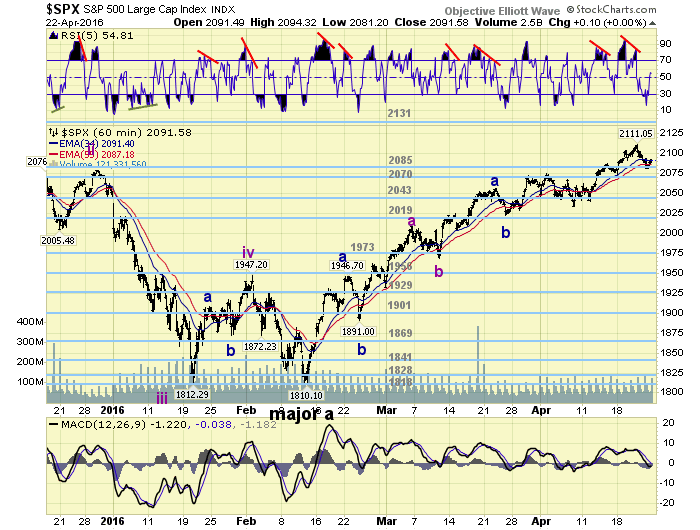
The key levels going forward are SPX 2111, 2074, and 2034. Should the market exceed SPX 2111 it is obviously extending to higher highs. Should the market drop to SPX 2074, the recent five wave advance from 2034 has definitely concluded. Should the market drop to SPX 2034, then the entire uptrend may have concluded as well. Short term support is at the 2085 and 2070 pivots, with resistance at SPX 2104 and SPX 2116. Short term momentum ended the week at neutral. Trade what’s in front of you!
FOREIGN MARKETS
The Asian markets were mostly higher and gained 0.8% on the week.
European markets were mostly higher and gained 2.6% on the week.
The Commodity equity group were mixed and gained 1.5% on the week.
The DJ World index gained 0.7% on the week.
COMMODITIES
Bonds continue to weaken and lost 0.9% on the week.
Crude made a higher uptrend high gaining 4.7% on the week.
Gold appears to be in a downtrend and lost 0.5% on the week.
The USD is trying to establish an uptrend and gained 0.4% on the week.
NEXT WEEK
Monday: New home sales at 10am. Tuesday: Durable goods, Case-Shiller and Consumer confidence. Wednesday: the FOMC statement and Pending home sales. Thursday: Q1 GDP (est. +0.3%) and weekly Jobless claims. Friday: PCE prices, Personal income/spending, the Chicago PMI and Consumer sentiment. Best to your weekend and week!
CHARTS: http://stockcharts.com/public/1269446/tenpp
After about 40 years of investing in the markets one learns that the markets are constantly changing, not only in price, but in what drives the markets. In the 1960s, the Nifty Fifty were the leaders of the stock market. In the 1970s, stock selection using Technical Analysis was important, as the market stayed with a trading range for the entire decade. In the 1980s, the market finally broke out of it doldrums, as the DOW broke through 1100 in 1982, and launched the greatest bull market on record.
Sharing is an important aspect of a life. Over 100 people have joined our group, from all walks of life, covering twenty three countries across the globe. It's been the most fun I have ever had in the market. Sharing uncommon knowledge, with investors. In hope of aiding them in finding their financial independence.
Copyright © 2016 Tony Caldaro - All Rights Reserved Disclaimer: The above is a matter of opinion provided for general information purposes only and is not intended as investment advice. Information and analysis above are derived from sources and utilising methods believed to be reliable, but we cannot accept responsibility for any losses you may incur as a result of this analysis. Individuals should consult with their personal financial advisors.
Tony Caldaro Archive |
© 2005-2022 http://www.MarketOracle.co.uk - The Market Oracle is a FREE Daily Financial Markets Analysis & Forecasting online publication.