Stocks Bear Market 2016 Illusion Persists Despite Dow Targeting New All Time High
Stock-Markets / Stock Markets 2016 Apr 21, 2016 - 09:36 AM GMTBy: Nadeem_Walayat
 The so called great stocks bear market of 2016 that apparently began following the Dow's May 2015 all time high of Dow 18,351, has seen bear market rhetoric reaching its most fever pitch as the Dow bottomed out in late August 2015 at Dow 15,370, and then again more recently in January of this year. So how has this so called bear market been progressing? A bear market heralded by even those who may have been bullish from time to time.
For instance a quick google search resolves in the following headlines from one prominent analyst. “The Dow is set to embark on a catastrophic plunge…all the way down to 6,000.” - Harry Dent - 29th Feb 2016
And a selection from moneymorning.com - 28th August, - Is This a Bear Market?
It actually indicates there's a 99.7% chance we're already in a bear market.
And money morning continuing into early November This One Number Makes Me Think the Market Rally Is Over
I believe the S&P 500 is entering a bear market and we are now experiencing a classic bear market rally.
And more recently Here's Why the Bear Market Rally Could End Soon - 10th April 2016 (Dow 17,577)
Last week the stock market experienced a pop in volatility. Often, higher volatility signals a shift from one type of market to another.
In this case, it may indicate that the market rally is coming to an end and the bear market will resume.
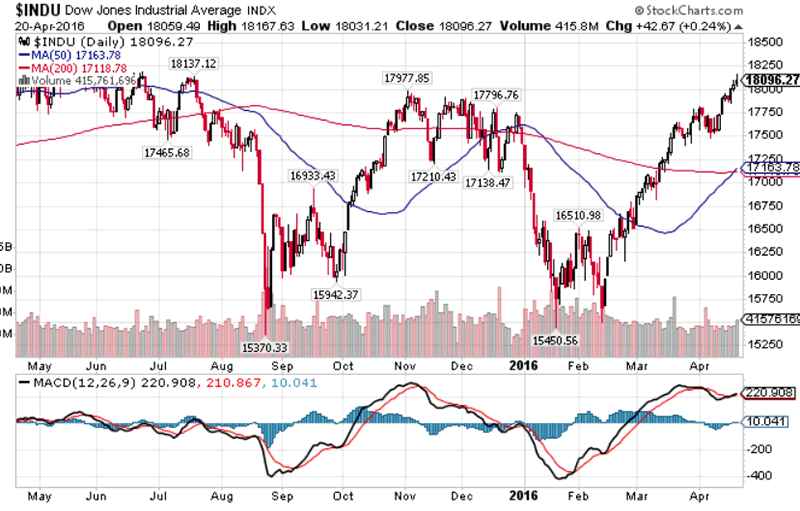
Well the Dow's last close of 18,096 says it all! The Dow now stands a little over 1% away from setting a NEW ALL TIME HIGH! Yes, as the Dow chart illustrates the ride has been bumpy to say the least, where in dozens of stock market articles during the past 9 months, (http://www.marketoracle.co.uk/UserInfo-Nadeem_Walayat.html) I illustrated that it is what an ageing bull market actually wants to see happen so that it can keep giving the bears a noose to put around their necks every few months or so, along with shaking out weak longs, it's when virtually everyone's bullish and certain of rising stock prices when bull markets tend to END!
And a reminder that my consistent view for the duration of this year, even in the depths of Januarys severe correction was that the stock market would resolve with a trend towards NEW ALL TIME HIGHS THIS YEAR based on my in-depth crude oil price analysis of Mid January:
02 Mar 2016 - Stock Markets Dow, FTSE Tracking Crude Oil Rally Towards New All Time Highs 2016!
Nevertheless my series of interim stock market posts and videos have been unequivocally consistent in the following two points :
1. That the stock market was under going a severe correction that would resolve in a resumption of the stocks bull market.
2. That the stock market was expected to track the crude oil price trend forecast which called for an early Feb low at approx $25.
25 Jan 2016 - Stock Market Bottoming Out or the Last Bull Standing?
Stock Market Quick Technical Take
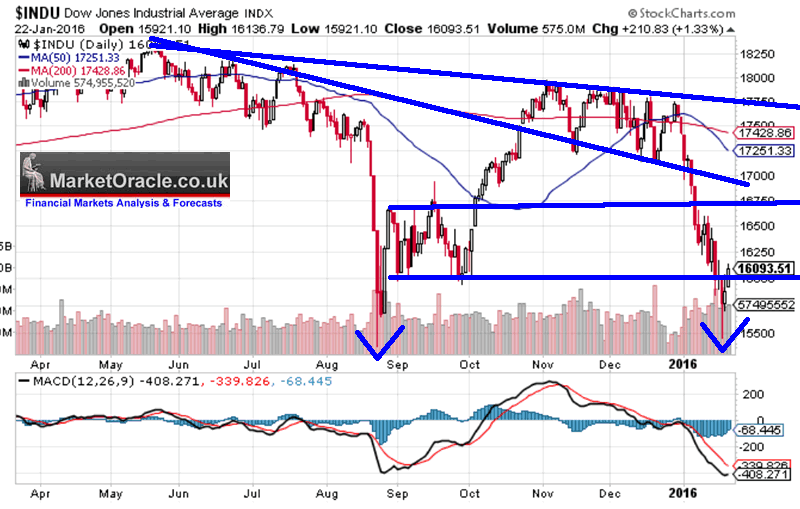
What jumps out form the stock chart is that the recent bounce was off the August low, can it hold ? We'll the decline into the low was pretty severe which technically means it's unlikely to hold which means that the stock market is in a larger corrective pattern that began of the May 2015 high, which is a pretty lengthy corrective pattern in terms of time i.e. from May to probably February, which has acted to unwind much bullish sentiment to the point where even many of the former bulls are now fully fledged bears, probably reaching their most vocal just as the stock market puts in its bottom.
MACD - Additionally the MACD is in the process of bottoming out from an extreme low which also confirms that further downside is very limited.
The bottom line is that the oil price trend and the stock markets oversold state are converging towards a stock market bottom that should carve out a final bottom for 2016 in a time window that probably runs for another 2-3 weeks. So whilst it is probably not going look pretty i.e. the last low of 15,500 looks likely to break, however given the oil price trend forecast then it should form the end of this stock market correction and herald the resumption of the stocks bull market.
However, there are times when even a bull can be surprised by bull market strength as illustrated by most recent interim analysis of 30th March 2016 that concluded in expectations for an imminent correction of about 5% starting early April so as to hand the bears another noose to hang themselves with, as I expected the correction to eventually resolve in a trend towards new all time highs -
30 Mar 2016 - Stocks Bull Market About to Hand Bears Another Noose? Forecast 2016
Stock Market Forecast
Whilst the Dow has yet to give a technical SELL signal, i.e. is still in rally mode. Nevertheless component analysis is clearly converging towards imminent bearish expectations for the stock market. However, we would still be in a BULL market, which implies that stocks are likely to undergo a correction to a range of between Dow 16,800 to as low as Dow 16,500 against the last close of 17,633 over the coming weeks ahead of the Fed or another major central bank announcing its going to print money for election year 2016.
Therefore, as the title of this article implies, the bears are about to be handed another noose to put around their necks, who I am sure will reach their most vocal just as the stock market correction bottoms and snaps higher by probably late April.
Alternative
If the conclusion for a correction proves wrong then the next most probable alternative would be for the Dow to blast off towards new all time highs, which will likely also be accompanied by stronger oil prices.
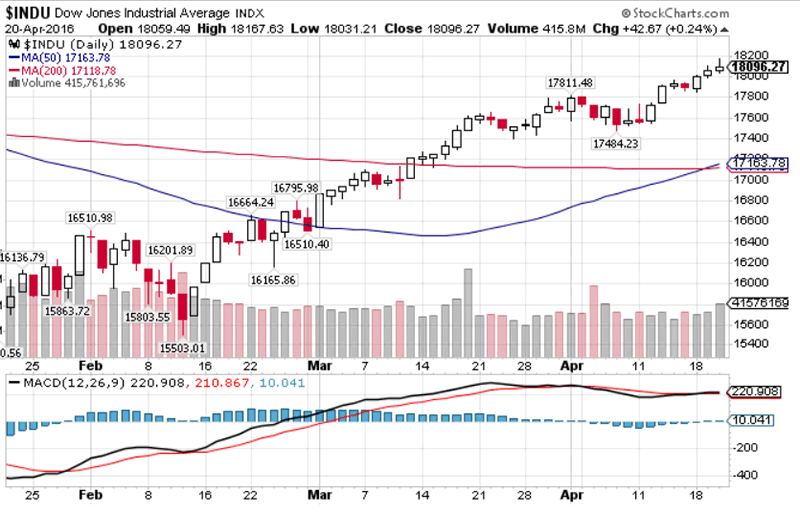
We'll the short-term chart clearly illustrates that the correction soon petered out early April, more or less failing to materialise to anywhere near to the expected extent that I had concluded as having a 60% probability of occurring, whilst a trend to new all time highs at about 30% against just 5% that the correction could resolve into a bear market.
Why? Well the answer is there, the oil price correction of late March did an abrupt return early April and since has swing to new highs for 2016 of $44.
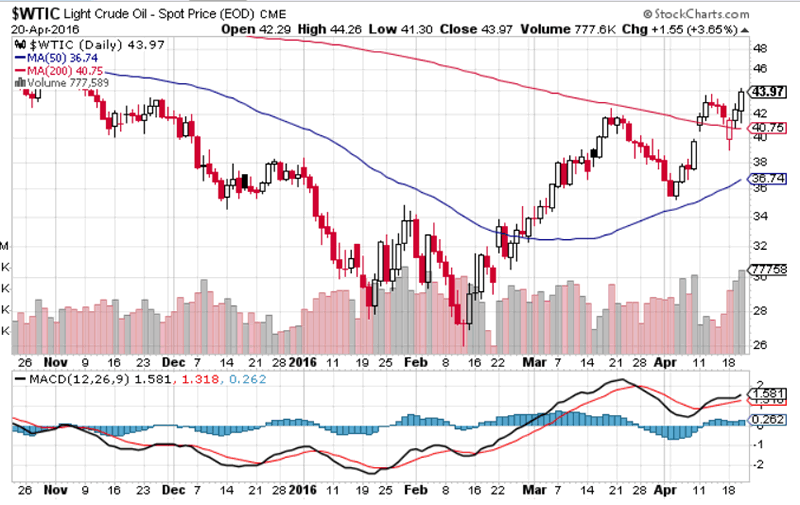
The bullish trend in oil prices is marginally ahead of my forecast expectations for 2016 -
17 Jan 2016 - Crude Oil Price Crash Triggering Global Instability, Trend Forecast 2016
Crude Oil Price 2016 Forecast Conclusion
My forecast conclusion is for the crude oil price to trade within three distinct trading ranges for 2016 of $20 to $40, $35 to $50 and $62 to $40. Furthermore the trend pattern imposed onto the trading ranges implies that a bottom is likely by early February 2016 at around $25, followed by a trend higher into Mid year towards $50, a correction into September, followed by a trend towards $62 before succumbing to a correction during December to target an end year price of approx $48 as illustrated by the following forecast graph.
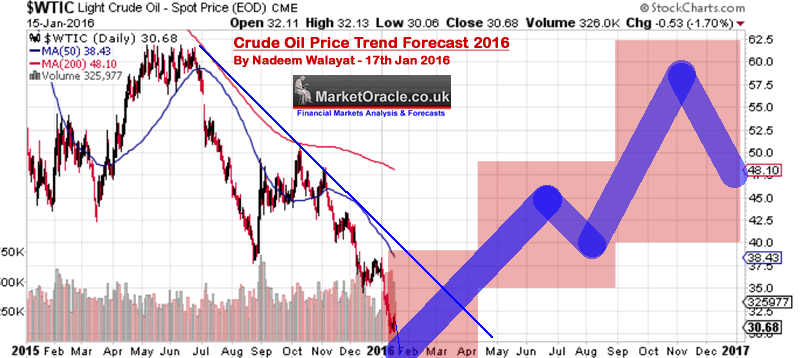
The bottom line is that the current the oil price collapse is a wake up call to all major oil producers that crude oil as an energy source is running out of time. So whilst there may be future oil price spikes, however the long-term trend, given the likes of climate change is for the oil age to go the way of previous ages such as the Stone Age and Bronze age and so it will be for the oil age. Which means nations such as Saudi Arabia, regardless of price understand they need to get as much of their oil out of the ground as possible and sold off before they run out of customers!
The bottom line is that the bears are going to keep shorting this stocks bull market all the way to new all time highs and then some.
Ensure you are subscribed to my always free newsletter (only requirement is an email address) for forthcoming in-depth analysis and detailed trend forecasts that include the following :
- US Dollar Trend Forecast
- UK Housing Market Trend Forecasts
- US Stock Market Forecasts
- US House Prices Detailed Multi-Year Trend Forecast
- Gold and Silver Price Forecast
By Nadeem Walayat
Copyright © 2005-2016 Marketoracle.co.uk (Market Oracle Ltd). All rights reserved.
Nadeem Walayat has over 25 years experience of trading derivatives, portfolio management and analysing the financial markets, including one of few who both anticipated and Beat the 1987 Crash. Nadeem's forward looking analysis focuses on UK inflation, economy, interest rates and housing market. He is the author of five ebook's in the The Inflation Mega-Trend and Stocks Stealth Bull Market series that can be downloaded for Free.
 Nadeem is the Editor of The Market Oracle, a FREE Daily Financial Markets Analysis & Forecasting online publication that presents in-depth analysis from over 1000 experienced analysts on a range of views of the probable direction of the financial markets, thus enabling our readers to arrive at an informed opinion on future market direction. http://www.marketoracle.co.uk
Disclaimer: The above is a matter of opinion provided for general information purposes only and is not intended as investment advice. Information and analysis above are derived from sources and utilising methods believed to be reliable, but we cannot accept responsibility for any trading losses you may incur as a result of this analysis. Individuals should consult with their personal financial advisors before engaging in any trading activities.
Nadeem Walayat Archive |
© 2005-2022 http://www.MarketOracle.co.uk - The Market Oracle is a FREE Daily Financial Markets Analysis & Forecasting online publication.


