


A Powerful Signal for the Coming Silver Price Rally
Commodities / Gold and Silver 2016 Apr 19, 2016 - 12:23 PM GMTBy: Hubert_Moolman

 The silver price and the US Dollar/South African Rand exchange rate (USD/ZAR) have a very interesting relationship that goes back a long way. Due to the nature of this relationship, I have found the USD/ZAR chart to be a good tool for determining a silver bottom.
In Jan 1980, when silver peaked at about $50, the USD/ZAR was trading at around 0.817. Today, the USD/ZAR rate is trading at about 14.366 - about 17.6 times higher than the Jan 1980 rate, whereas silver is trading at $16.2 - almost three times lower than the Jan 1980 high.
So, in the long run, the two move in opposite directions. When the USD/ZAR rate is moving up, then the silver price is moving down, and vice versa. Furthermore, when the USS/ZAR rate is making a top, then a bottom in silver is normally very close (before or after the USD/ZAR peak).
In a related manner, the US Dollar Index provides a good signal for when gold rallies are coming.
Below is a basic short-term fractal analysis of the USD/ZAR chart (from fxstreet.com):
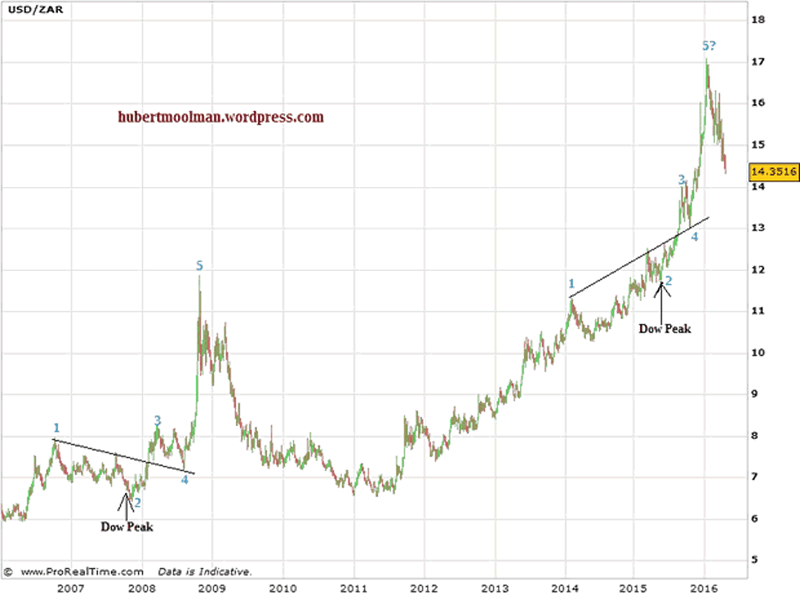
On the chart I have highlighted two possible fractals (with points 1 to 5). The fractals are very similar (the angle is a bit different), and importantly appear during similar conditions (relative to a Dow peak). The second fractal appears to have reached point 5, which is a short-term top for the USD/ZAR chart, and very likely a long-term peak (since 1980).
If it is indeed a long term peak for the USD/ZAR rate, then one should expect a very important bottom for silver around that date. Silver did make a bottom on 14 December 2015, about a month before the USD/ZAR top. This silver bottom will likely proof to be the ultimate low before the coming multi-year rally.
Below, is another comparison (from my 12 Feb 2016 premium update), showing the relationship between USD/ZAR peaks and silver bottoms:
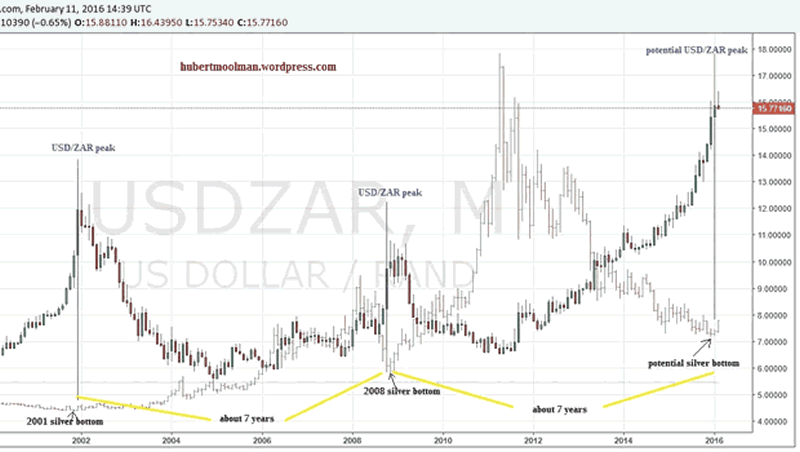
On the chart (from tradingview.com), I have drawn blue lines at the 2001, 2008 and potential Jan 2016 USD/ZAR peaks. One can see how close to these peaks the 2001, 2008 and potential Dec 2015 silver bottoms were.
Given, the look of the Jan 2016 candlestick; it is likely that the USD/ZAR chart has peaked.
If it has indeed peaked, then there is a very strong likelihood that the December 2015 bottom in silver is actually the bottom since the 2011 peak. It is interesting to note that there is a 7-year interval between the silver bottoms.
For more of this kind of analysis on silver and gold, you are welcome to subscribe to my premium service. I have also recently completed a Long-term Silver Fractal Analysis Report .
Warm regards
Hubert
“And it shall come to pass, that whosoever shall call on the name of the Lord shall be saved”
http://hubertmoolman.wordpress.com/
You can email any comments to hubert@hgmandassociates.co.za
© 2016 Copyright Hubert Moolman - All Rights Reserved
Disclaimer: The above is a matter of opinion provided for general information purposes only and is not intended as investment advice. Information and analysis above are derived from sources and utilising methods believed to be reliable, but we cannot accept responsibility for any losses you may incur as a result of this analysis. Individuals should consult with their personal financial advisors.
© 2005-2022 http://www.MarketOracle.co.uk - The Market Oracle is a FREE Daily Financial Markets Analysis & Forecasting online publication.