


Gold Price What Breakout?
Commodities / Gold and Silver 2016 Apr 16, 2016 - 10:43 PM GMTBy: Clive_Maund

 The latest gold COTs are out and they are an absolute horror story, with Commercial short and Large Spec long positions having ramped up to multi-year extremes, which we can take to mean that the dollar is not going to crash its support in the 93 area and will instead rally.
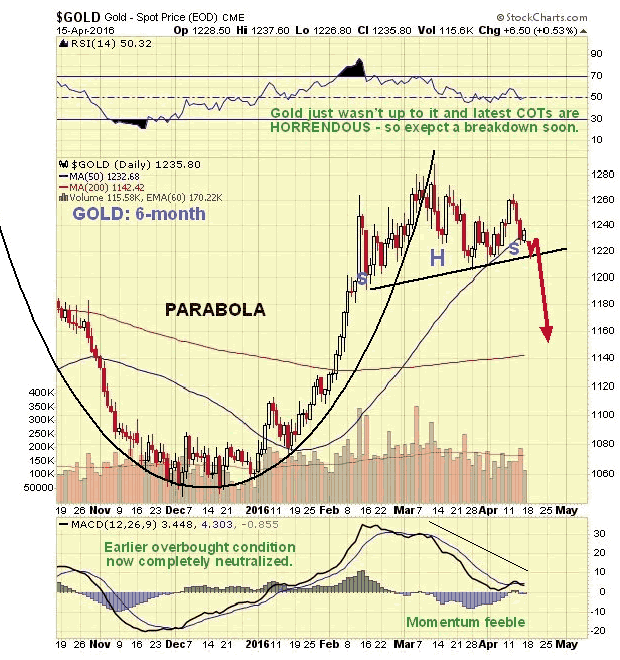
While PM stocks have broken higher, gold has stubbornly refused to and has been dropping back in recent days to complete the Right Shoulder of what is believed to be a Head-and-Shoulders top, as we can see on its 6-month chart below. Once it breaches the neckline of the pattern it should plunge. This will not be a surprising outcome, as it is very rare for a parabolic blowoff move such as we saw earlier to be followed by continued advance.
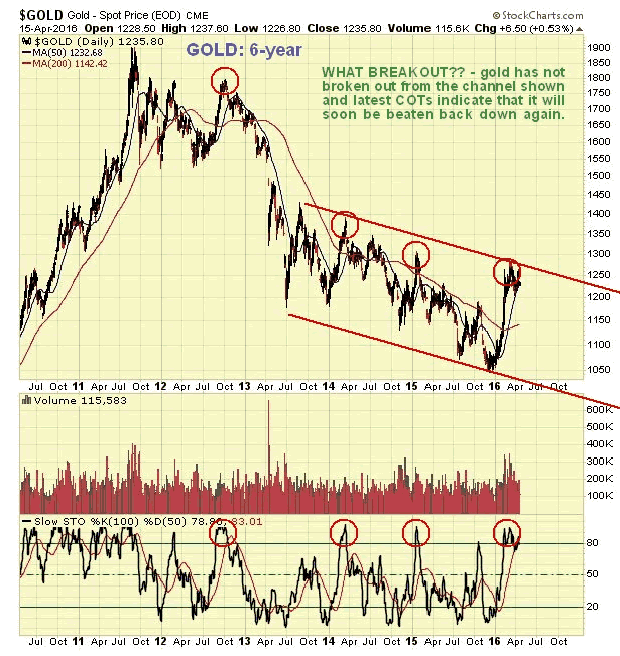
The 6-year chart also shows why there are grounds for caution here. Gold has stalled out at the upper boundary of the channel shown, with its slow stochastic indicating that it is topping out...
Now we come to the latest COTs, where we see that Commercial Short and Large Spec long positions rose sharply again to new highs last week, just as gold marked out its Right Shoulder peak last Tuesday. Large Specs are "foaming at the mouth" bullish, but look set to end up like the Plains buffalo, with the Commercials, the Big Money players, set to kill them and skin them by the thousand.
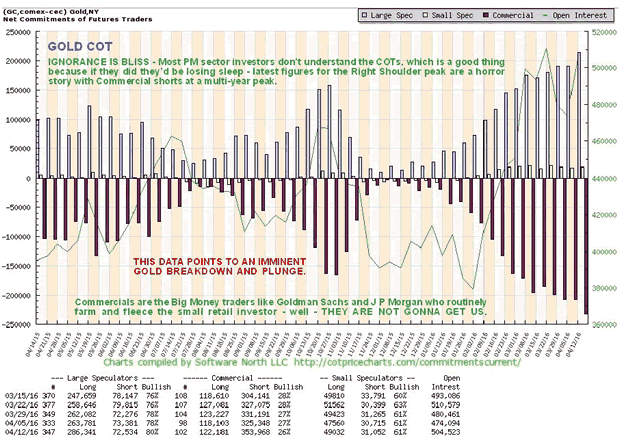
Click on chart to popup larger clearer version.
The latest gold Hedgers chart, which is a form of COT chart that goes back further, shows that Hedger's positions are at multi-year negative values, which again does not augur well for gold.
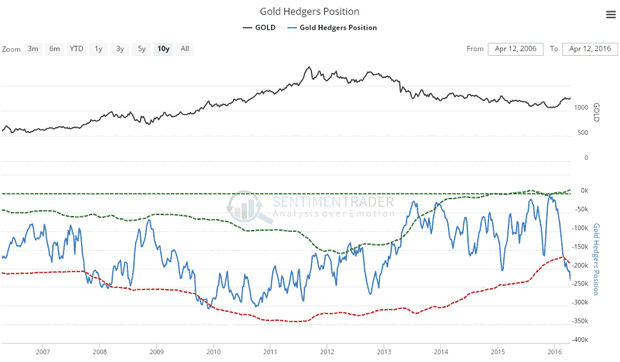
Chart courtesy of www.sentimentrader.com
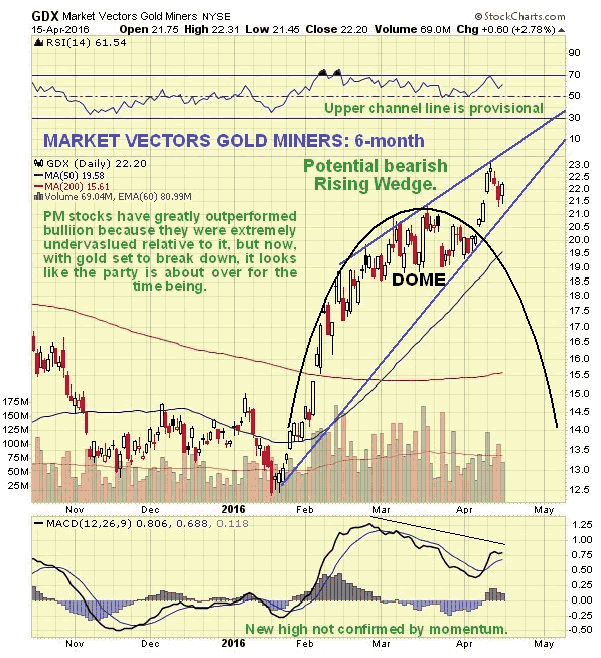
The marked outperformance of PM stocks relative to both gold and silver has been due to them being grossly undervalued relative to bullion, but now this strong performance is believed to be leading many investors into the jaws of a trap. On its 6-month chart we can see how GDX broke out of its Dome pattern and advanced to new highs, which have not been confirmed by momentum (MACD). Although this chart still looks superficially OK, what we have observed above for gold and its COTs suggests that a bearish Rising Wedge might be forming in GDX, a suspicion that will be confirmed by a sharp breakdown from the converging channel soon.
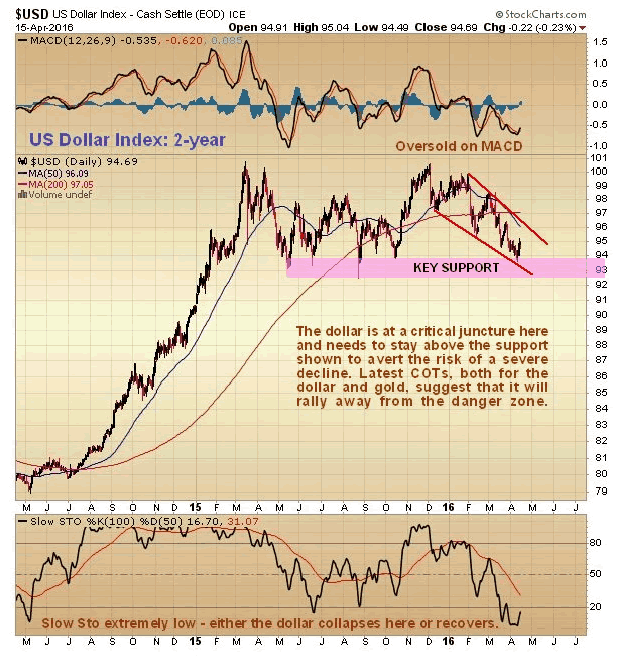
As ever, the dollar is key, and it has been recent dollar weakness that has encouraged the PM sector recovery, as investors in the sector salivate over the prospects for a dollar breakdown and collapse, However, both the latest dollar and gold COT charts suggest that this is not going to happen - instead, the dollar looks set to rally soon. On its 2-year chart we can see that this year it has dropped back towards the key support level shown at the lower boundary of a potential top area. But the convergence of the downtrend channel and the oversold condition on its MACD and Slow Stochastic suggest that it is likely to turn up again soon, a process which may have begun last week. The big trading range may yet turn out to be a top, but first it looks likely that we will see another rally towards its upper boundary, which, needless to say, would not be good news for the PM sector.
The latest dollar Hedgers chart, while not exactly raving bullish, is looking a whole lot better than it did a year ago, and certainly indicates that there is scope for a significant dollar rally here...
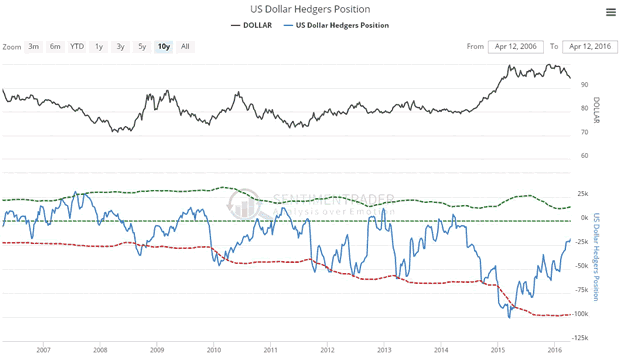
Chart courtesy of www.sentimentrader.com
The Fed is now in a very unenviable position, having painted itself into a corner, and is reaping what it has sown. Its first priority is to do the bidding of its crony pals on Wall St and keep the stockmarket levitated by refusing to raise interest rates, but if it continues to follow this course the dollar is likely to crash the support shown on our chart and plunge, an outcome which will upset some very powerful people in Washington. Latest COTs are showing that Big Money is betting on the dollar rallying, which means that a rate rise is probably more likely than many are thinking.
By Clive Maund
CliveMaund.com
For billing & subscription questions: subscriptions@clivemaund.com
© 2016 Clive Maund - The above represents the opinion and analysis of Mr. Maund, based on data available to him, at the time of writing. Mr. Maunds opinions are his own, and are not a recommendation or an offer to buy or sell securities. No responsibility can be accepted for losses that may result as a consequence of trading on the basis of this analysis.
Mr. Maund is an independent analyst who receives no compensation of any kind from any groups, individuals or corporations mentioned in his reports. As trading and investing in any financial markets may involve serious risk of loss, Mr. Maund recommends that you consult with a qualified investment advisor, one licensed by appropriate regulatory agencies in your legal jurisdiction and do your own due diligence and research when making any kind of a transaction with financial ramifications.
Clive Maund Archive |
© 2005-2022 http://www.MarketOracle.co.uk - The Market Oracle is a FREE Daily Financial Markets Analysis & Forecasting online publication.