


Energy Sector Set To Save the Stock Market
Stock-Markets / Stock Markets 2016 Apr 11, 2016 - 06:10 PM GMTBy: Chris_Vermeulen

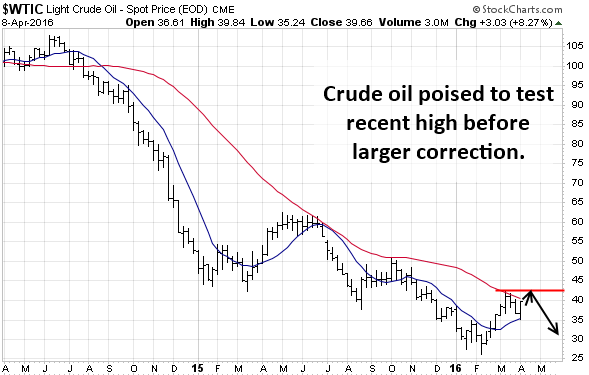
 Over the past few week, we have seen the price of crude oil pullback from its recent high of $42 per barrel level. Last week April 4-8th the price of crude oil pulled back to a technical support zone and then posted a strong gain closing the weekly chart at the high.
Based on short-term technical indicators, along with the current momentum which crude oil has, I feel we will see the recent highs of $42 a barrel tested once again.
So what does this mean for energy stocks in the stock market as a whole? Well, if things unfold this week as I expect they will then we should see oil rise along with, energy stocks, and the S&P 500 index.
Take a look at the chart of crude oil below:
This weekly chart of oil shows what I expect will happen over the next one to three weeks, a bounce in price.
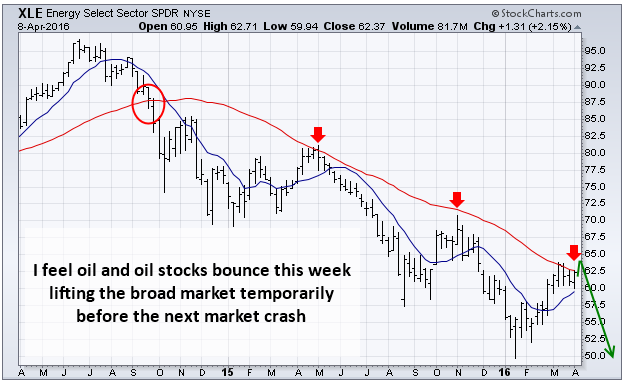
XLE Energy Sector Index Fund:
Energy stocks of had a strong rally since the lows earlier this year. But as you can see from the chart and basic technical analysis the price is now running into resistance at the moving average.
The moving average has acted as resistance for price and price is currently struggling at that level once again. I wouldn’t be surprised though to see the XLE fund push higher one last time testing the recent highs from last month before it tops and starting another large correction.
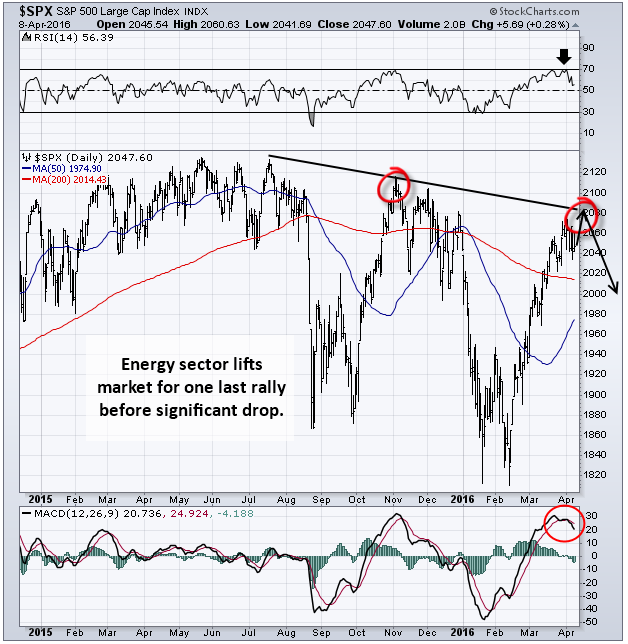
The US stock market:
While the US stock market has posted strong gains since the January low, I feel this rally is going to come to an abrupt stop this month or in May.
If oil and energy stocks continue to move higher than we should see the stock market follow suit and for the S&P 500 to rally one last time up into a resistance zone before the next big wave of sellers step back into the market.
Energy & Stock Market Conclusion:
In short, I feel the US large-cap stocks are setting up for an epic drop in price. My technical analysis and cycle analysis are lining up very similar to what I saw during the 2000-2001 market top and the 2007 – 2008 market top. Investors should expect a 35% to 50% market correction over the next 12+ months.
With that said, the next few weeks will become very difficult to trade simply because the market is starting to get choppy with wild intraday price swings. This is because the average market participants are becoming more bullish than ever on stocks again while the large institutions are starting to distribute huge amounts of shares to these undereducated investors who don’t know technical analysis and stock market cycles.
My current mindset has been to go into the markets for as little as 48 hours and then exit with a nice handsome profit using a strategy known as Price Spikes. This has worked out very well this year capturing very quick profits from these special “price spikes’. It’s a simple “Get-In & Get-Out” strategy for highly volatile markets.
Good times are coming for us active traders and investors so buckle up!
If you would like to know when to buy and sell as a short-term trader or long-term investor using ETF’s and join me at www.TheGoldAndOilGuy.com
Chris Vermeulen
Join my email list FREE and get my next article which I will show you about a major opportunity in bonds and a rate spike – www.GoldAndOilGuy.com
Chris Vermeulen is Founder of the popular trading site TheGoldAndOilGuy.com. There he shares his highly successful, low-risk trading method. For 7 years Chris has been a leader in teaching others to skillfully trade in gold, oil, and silver in both bull and bear markets. Subscribers to his service depend on Chris' uniquely consistent investment opportunities that carry exceptionally low risk and high return.
Disclaimer: Nothing in this report should be construed as a solicitation to buy or sell any securities mentioned. Technical Traders Ltd., its owners and the author of this report are not registered broker-dealers or financial advisors. Before investing in any securities, you should consult with your financial advisor and a registered broker-dealer. Never make an investment based solely on what you read in an online or printed report, including this report, especially if the investment involves a small, thinly-traded company that isn’t well known. Technical Traders Ltd. and the author of this report has been paid by Cardiff Energy Corp. In addition, the author owns shares of Cardiff Energy Corp. and would also benefit from volume and price appreciation of its stock. The information provided here within should not be construed as a financial analysis but rather as an advertisement. The author’s views and opinions regarding the companies featured in reports are his own views and are based on information that he has researched independently and has received, which the author assumes to be reliable. Technical Traders Ltd. and the author of this report do not guarantee the accuracy, completeness, or usefulness of any content of this report, nor its fitness for any particular purpose. Lastly, the author does not guarantee that any of the companies mentioned in the reports will perform as expected, and any comparisons made to other companies may not be valid or come into effect.
Chris Vermeulen Archive |
© 2005-2022 http://www.MarketOracle.co.uk - The Market Oracle is a FREE Daily Financial Markets Analysis & Forecasting online publication.