


Stock Market Risk-off Gaining Momentum
Stock-Markets / Stock Markets 2016 Apr 09, 2016 - 05:17 PM GMTBy: Tony_Caldaro

 The week started at SPX 2073. After an attempt to make new uptrend highs on Monday the market pulled back to SPX 2043 by Wednesday morning, then rallied to 2061 in the afternoon. Thursday’s gap down opening took the market down to SPX 2034. Friday had a gap up opening carrying the market to SPX 2061. Then the market reversed to end the week at 2048. For the week the SPX/DOW lost 1.2%, the NDX/NAZ lost 1.3%, and the DJ World index lost 0.7%. On the economic front reports came in even. On the uptick: ISM services, consumer credit, the WLEI, plus weekly jobless claims improved. On the downtick: factory orders, wholesale inventories, the GDPN, plus the trade deficit widened. Next week’s reports will be highlighted by Industrial production, the FED’s beige book and the CPI.
LONG TERM: bear market
While many of the world’s markets have dropped 20% to 25% from their 2015 highs. The SPX/DOW have only declined 15%, and have recently rebounded to within a few percent of their all time high. As a result, many have questioned our bear market call and rightly so. No system, or methodology is perfect. And even if the method is quantified, it still takes an imperfect being to interpret it. With this in mind, investors should make their own decisions, and not rely on others to make these decisions for them.
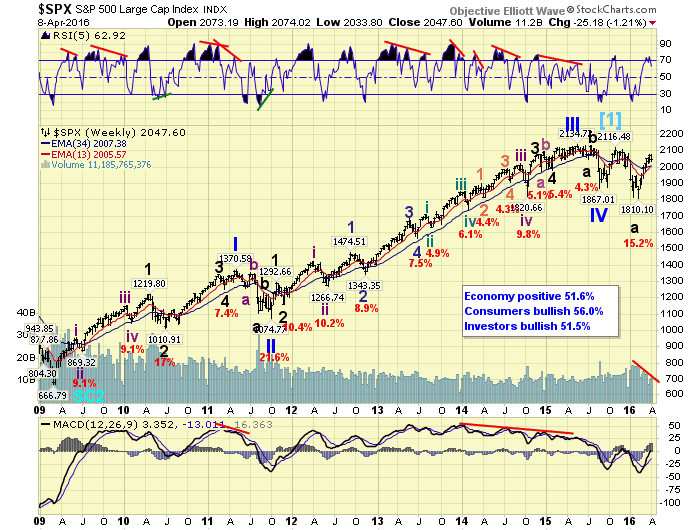
We continue to interpret the market activity since December as the beginning of a bear market. The expected five Primary wave bull market, Cycle wave [1], ended in December 2015. Since then the market sold off to its lowest level in two years. Then rebounded within 3% of the all time high just over one week ago. Quite a volatile market after four years of corrections no larger than 10%, and trending uptrends. Just look at the weekly chart. While looking you may note that volume, which we rarely even look at, has been declining throughout this entire uptrend. During the bull market, uptrends after steep selloffs have displayed at least steady even volume.
MEDIUM TERM: uptrend weakening
With this Major B wave uptrend now two months old we continue to see signs of a topping pattern. Both the daily RSI and MACD are displaying the typical negative divergences that often accompany uptrend highs, and both have already turned down. The risk-on mentality of rising world markets, rising commodity prices, and declining bond prices, have begun to reverse. Thirty percent of the foreign markets we track and sixty percent of the commodity sectors are in confirmed downtrends, plus Bonds are in an uptrend. As risk-off strengthens the current uptrend should continue to weaken.
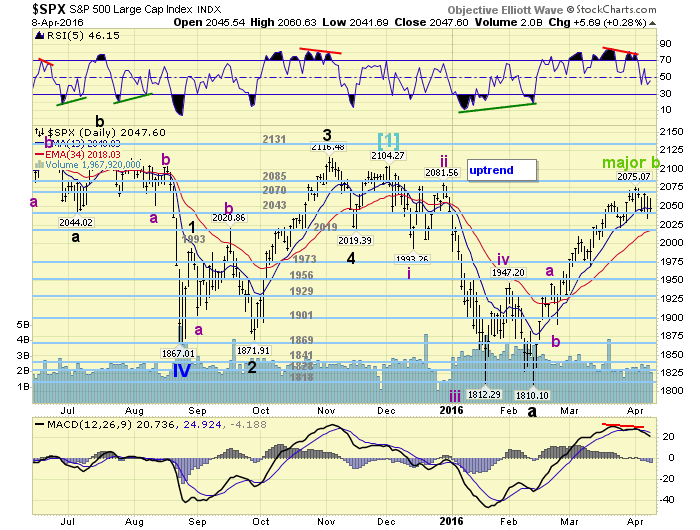
We are still labeling this Major wave B as three Intermediate waves: 1947-1891-2075. Intermediate wave C is currently about 34% longer than Int. A (184 pts. v 137 pts.). A bit of an odd relationship, but it has subdivided several times. While there are several possible counts for this uptrend we posted the one most preferred. With the market running into resistance at the 2070 pivot this past two weeks, we continue to see lots of overhead resistance. For now we post the current range with support at the 2043 and 2019 pivots and resistance at the 2070 and 2085 pivots.
SHORT TERM
While the daily indicators have been displaying a potential top the market has been working its way lower. From the SPX 2075 uptrend high the market declined in three waves to SPX 2034: 2043-2067-2034. Then on Friday it hit a high, after a gap up opening, of SPX 2061 before closing the gap when reaching 2042 in the last hour of trading.
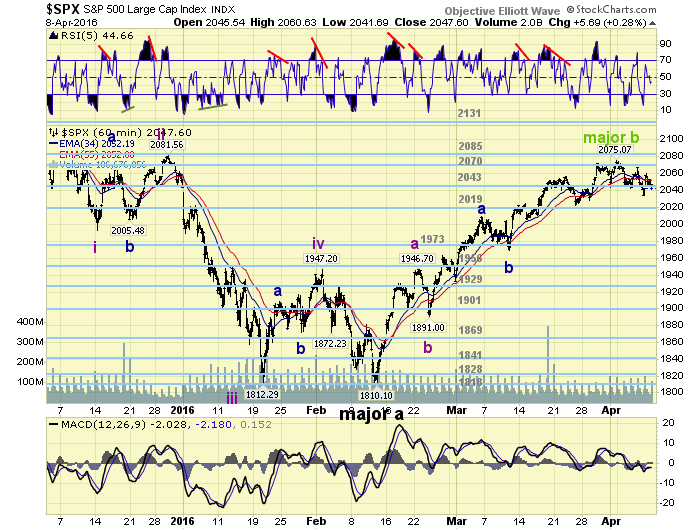
To keep the momentum going to the downside the market needs to drop below SPX 2034, before exceeding SPX 2061. Then reach and break the 2019 pivot range. This would display the largest decline since the uptrend began back in mid-February, and likely suggest a new downtrend is well underway. Any rally above SPX 2061, before breaking 2034, could suggest the uptrend is extending yet again. Short term support is at the 2043 and 2019 pivots, with resistance at the 2070 and 2085 pivots. Short term momentum ended the week around neutral.
FOREIGN MARKETS
Asian markets were all lower on the week for a net loss of 0.9%.
European markets were mostly lower for a net loss of 0.8%.
The Commodity equity group were mixed and gained 0.5%.
The DJ World index lost 0.7% on the week.
COMMODITIES
Bonds continue to uptrend and gained 0.5%.
Crude is still in an uptrend and gained 8.4%.
Gold appears to be in a downtrend but gained 1.7%.
The USD remains in a downtrend and lost 0.4%.
NEXT WEEK
Tuesday: Export/Import prices and the Budget deficit. Wednesday: the PPI, Retail sales, Business inventories and the FED’s beige book. Thursday: weekly Jobless claims, the CPI, and Senate testimony from FED governor Powell. Friday: the NY FED, Industrial production, Consumer sentiment and Options expiration. Best to your weekend and week!
CHARTS: http://stockcharts.com/public/1269446/tenpp
After about 40 years of investing in the markets one learns that the markets are constantly changing, not only in price, but in what drives the markets. In the 1960s, the Nifty Fifty were the leaders of the stock market. In the 1970s, stock selection using Technical Analysis was important, as the market stayed with a trading range for the entire decade. In the 1980s, the market finally broke out of it doldrums, as the DOW broke through 1100 in 1982, and launched the greatest bull market on record.
Sharing is an important aspect of a life. Over 100 people have joined our group, from all walks of life, covering twenty three countries across the globe. It's been the most fun I have ever had in the market. Sharing uncommon knowledge, with investors. In hope of aiding them in finding their financial independence.
Copyright © 2016 Tony Caldaro - All Rights Reserved Disclaimer: The above is a matter of opinion provided for general information purposes only and is not intended as investment advice. Information and analysis above are derived from sources and utilising methods believed to be reliable, but we cannot accept responsibility for any losses you may incur as a result of this analysis. Individuals should consult with their personal financial advisors.
Tony Caldaro Archive |
© 2005-2022 http://www.MarketOracle.co.uk - The Market Oracle is a FREE Daily Financial Markets Analysis & Forecasting online publication.