Stock Market Nice & Nasti
Stock-Markets / Stock Markets 2016 Apr 07, 2016 - 06:05 PM GMTBy: Denali_Guide
 Volume & Breadth
Two reliable tools in my kit.

Two things I find RELIABLE are measures of Breadth, and Volume.
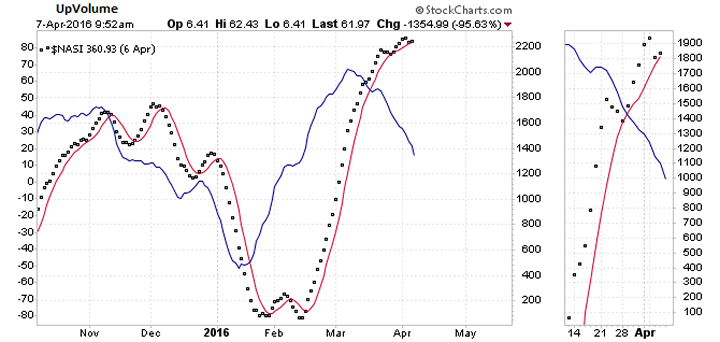
NAZ Up Volume (blue solid line) shown has modified with a common TA Math protocol. I include a similar chart for the NYSE.
$NASI, or Mr. Nasti as I call it, is the McClellan Summation Index for the NAZ, (dots), followed by a 6 day simple moving average (red solid line).The volume has fallen away, and the breadth (Mr. Nasti) is a hairs-width away from dropping thru the solid line which is a sell signal. NEXT CHART, NYA

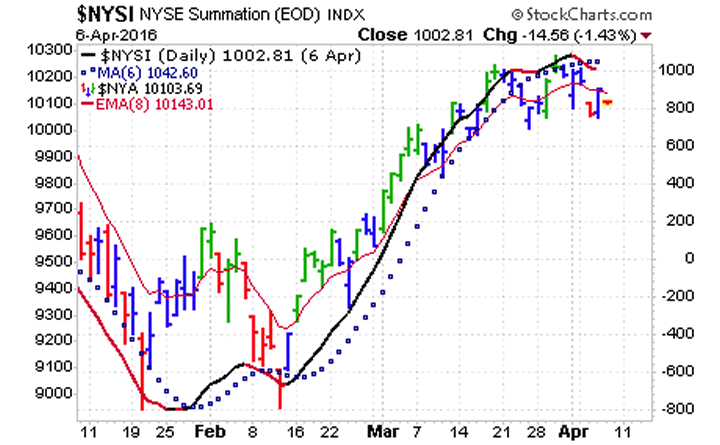
. NYA is the NYSE average, which is the average time, with the other averages being + or (-) some time intervals.

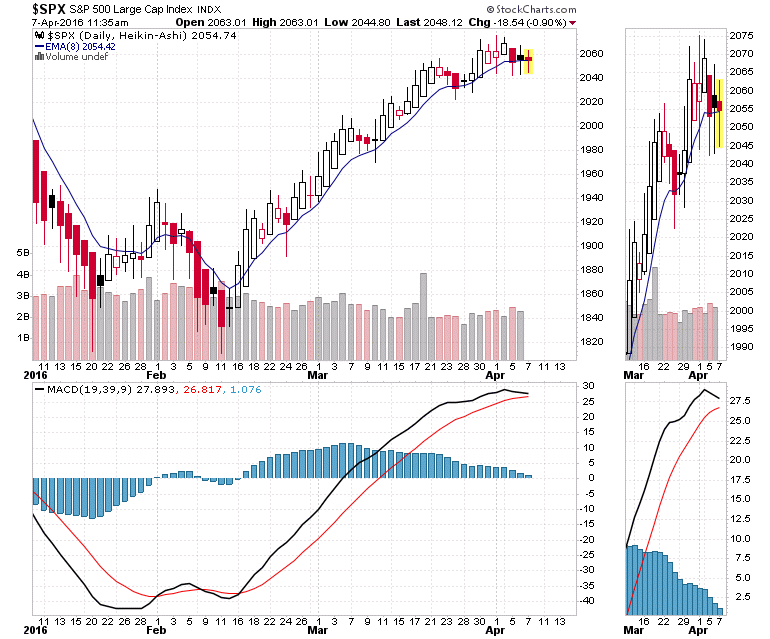
Given that the Standard Timer (NYA) is signaling sell and the NYA has dropped down thru its 8 day exponential moving average which I use for a trip wire, we can see the SPX resisting this due the tremendous support of manipulation it gets. However, before the week is out, In My Opinion, the SELL Signal for the SPX will be executed on these charts as the week draws to a close.
I'd say its OVER this week.
The complete report will be published in this weeks Peak Picks.
By Denali Guide
http://denaliguidesummit.blogspot.ca
To the the charts involved, go here, to my Public Stock Charts Portfolio, and go to the last section. All charts update automatically. http://stockcharts.com/public/1398475/tenpp/1
© 2016 Copyright Denali Guide - All Rights Reserved
Disclaimer: The above is a matter of opinion provided for general information purposes only and is not intended as investment advice. Information and analysis above are derived from sources and utilising methods believed to be reliable, but we cannot accept responsibility for any losses you may incur as a result of this analysis. Individuals should consult with their personal financial advisors.
© 2005-2022 http://www.MarketOracle.co.uk - The Market Oracle is a FREE Daily Financial Markets Analysis & Forecasting online publication.


