


Crude Oil and the 6 Year Cycle as Speculator Sentiment Reaches Extreme Highs
Commodities / Crude Oil Jul 15, 2008 - 04:03 PM GMTBy: Clif_Droke

 In previous commentaries we took a close look at the attributes of the 6-year cycle, which is bottoming this summer. The 6-year cycle is a component of the famous 120-year Kress Cycle and when it bottoms it tends to have a pronounced effect on stock prices and often the economy.
Right now the 6-year cycle is the paramount consideration trumping all other factors in the financial markets, whether it be the credit crisis, rising food and fuel costs or anything else. For every cause must have an effect and when it comes to the markets it's the cycles that are the chief cause behind the effects we're seeing.
Although the 6-year cycle is primarily an equities market cycle it also has a spill-over influence on commodity prices, especially the inflation-sensitive oil price. If we look at the long-term price history of crude oil we can see that the 6-year cycle can be divided into two halves of 3 years. Further, the first half of the 6-year cycle tends to have a depressing effect on the oil price while the second half of the cycle typically has a lifting effect. Not surprisingly, the crude oil price has been quite buoyant over the last three years which comprise the second half of the 6-year cycle.
To get a better idea of what I'm talking about let's look at a long-term graph of the Nymex Crude Oil futures price. The following monthly chart, courtesy of Commodity Price Charts, shows the monthly oil price from 1983 through 2002.
Notice that in the 3-year increments when the 6-year cycle is in the ascending phase the oil price typically makes lower highs and lower lows. During the three years of the 6-year cycle's declining phase the oil price tends to make higher highs and higher lows. Thus the 6-year cycle's impact on oil is the opposite of its effects on stocks and the economy during the two phases of the cycle.
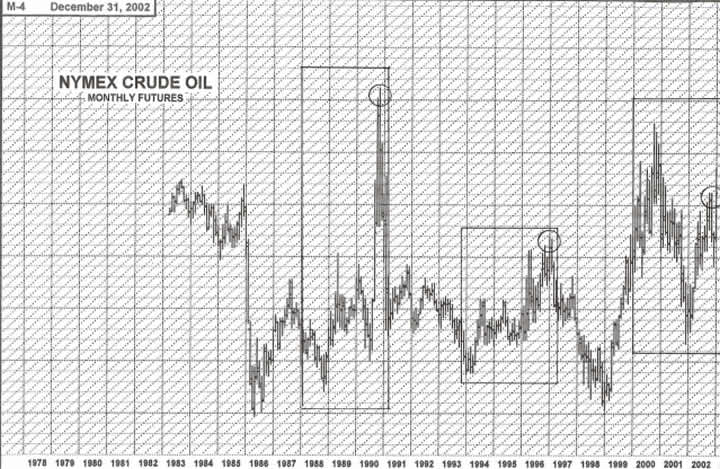
The 6-year cycle bottomed in each of the following years: 1984, 1990, 1996 and 2002. Although the 6-year cycle bottomed in 1984 and peaked in 1987, the oil price was subject to the fundamental disinflationary pressures of the 1980s which skewed the cycles effect in the oil price in those years. However, the peaking phase of the 6-year cycle in 1987 produced a noticeable rally in the oil price as you can see in the chart and was no doubt a contributing influence to the stock market crash that occurred in October of that year.
The last three years of the 6-year cycle from 1984-1990 is what is most important for our present study: after a brief inflationary surge in 1987 and a subsequent pullback in 1988 in response to the market crash of late '87, the oil price proceeded to rally vigorously to a then all-time high of $40/barrel in 1990 when the 6-year cycle bottomed. So here we find a performance that is typical of the oil price. The last half of the 6-year cycle usually brings rising oil prices.
The 6-year cycle that ended in late 1990 spawned another 6-year cycle that peaked in 1993. As per the norm, oil prices were in decline from the end of 1990 through the end of 1993. But from 1994 until 1996 when the 6-year cycle bottomed once again the oil price was on the rise once again, rallying from $14 to $27/barrel. Again we see that during the second half of the 6-year cycle oil prices tend to be in an uptrend.
During the first half of the next 6-year cycle from 1997-1999 oil made no net progress. It actually declined sharply in 1997-98 as the effects of commodities deflation were felt from the Asian currency crisis and LTCM hedge fund meltdown. During the latter part of '98 the price of crude oil fell to a multi-decade low of $10/barrel and the retail gasoline price in many cities was below $1/gallon. This trend was reversed during the second half of the 6-year cycle, which bottomed in 2002. You'll recall that the previous 6-year cycle bottom ended a vicious bear market in stocks as well as an economic recession.
Now we come to the latest 6-year cycle. The current 6-year cycle began in late 2002 and peaked in the summer of 2005. Yet the oil price was in a rising trend all during this time. Was this a negation of the 6-year cycle's normally depressing effect on commodity prices? Not at all, for there is also a 30-year rhythm in commodities which governs the long swings. This 30-year commodities cycle was (and still is) in its “hard up” phase throughout this decade. There are also fundamental reasons (China/India) and exogenous reasons (Middle East war) to account for the long-term rise in the crude oil price.
Yet the rise in the crude oil price from 2003-2005 was relatively subdued compared to the fevered pitch of the oil price spike in 2007-2008. The past year-and-a-half have witnessed by far the most extreme spike in the oil price since the 6-year cycle bottom in 1990. I believe this can be ascribed mainly to the influence of the final 6-year cycle bottoming process. The influence of hedge funds have only exacerbated the effects of the final descent of the 6-year cycle.
For stock prices, the final “hard down” phase of the 6-year cycle has been bad news. For oil and other key commodities it has been a source of significant buying pressure which has lifted prices to multi-decade highs. When the 6-year cycle finally bottoms later this summer we will likely witness a major shift in perceived value as money slowly exits the energy markets and finds its way back into the drastically oversold equities arena.
Concerning supply, in a recent editorial appearing in the Financial Times , Daniel Gros wrote that the supply of oil “will increase not when the price today is high, but only if suppliers expect that prices will be lower in [the] future.” As Gros points out, the implication here is that China influences oil prices today not so much because Chinese demand is currently high (Chinese demand currently accounts for less than 10 percent of global consumption of crude), but because demand in China is projected to dramatically increase in the future. This expectation, according to Gros, is what is fueling expectations of higher prices and thus leading producers to lower their rate of extraction today.
What happens, though, when these expectations aren't realized? Is it just possible that producers and speculators alike are putting too much weight on China's economic strength (and not enough on the 6-year cycle)? With the Chinese stock market down 50% from last year's highs, the implication is that an economic slowdown is soon coming to China (on the theory that stock market direction predicts the future economy of the economy by 6-9 months).
Despite the pronouncements of the pundits that China has largely “disconnected” from the U.S. economy, there is still strong reason for believing that the U.S. is leading China into a recession. The U.S. has been the first into the economic slowdown over the past couple of years and will likely be the first to emerge from it after the 6-year cycle bottoms, even as the other major economies are falling into recession. Would it not be the ultimate “head fake” if, after the summer Olympics in Beijing,” China's economy began rapidly cooling off and its demand for oil consumption declined? This would indeed take much of the air out of the oil price run-up.
Gros also points out that “The expectation that prices can only go up (and the fact that the return on capital remains low) is the real culprit” in the oil bubble. “A bubble starts when past price increases lead to expectations of future price increases,” he adds. “It could very well be that prices will not increase as much as expected if China's future demand for oil is lower than expected today, or if alternative energy supply sources become as cheap as some suggest.”
Speculator sentiment on crude is getting quite extreme on the bullish side of the aisle. Just last week the Financial Times published a headline which stated, “Investors bet on oil at $300 this year.” That sounds like the type of exuberant forecast that appears just before a major shift in momentum.
The article cited data provided by the New York Mercantile Excahge, which showed that investors for the first time placed a small bet in July that West Texas Intermediate oil futures would hit $300 a barrel – more than double the current price. Previously the highest bet was $275 a barrel and $200 remains the highest bet with significant investor interest, the FT said. Notwithstanding the current uptrend, I think it's safe to say these exuberant forecasts will be disappointed.
By Clif Droke
www.clifdroke.com
Clif Droke is the editor of the daily Gold & Silver Stock Report. Published daily since 2002, the report provides forecasts and analysis of the leading gold, silver, uranium and energy stocks from a short-term technical standpoint. He is also the author of numerous books, including 'How to Read Chart Patterns for Greater Profits.' For more information visit www.clifdroke.com
Clif Droke Archive |
© 2005-2022 http://www.MarketOracle.co.uk - The Market Oracle is a FREE Daily Financial Markets Analysis & Forecasting online publication.