


Crude Oil Price One-Day Rally or Something More
Commodities / Crude Oil Apr 06, 2016 - 12:31 PM GMTBy: Nadia_Simmons

 Trading position (short-term; our opinion): No positions are justified from the risk/reward perspective.
On Tuesday, crude oil moved lower after the market’s open weakened by an unexpected decline in monthly U.S. gasoline demand. Despite this drop, the commodity reversed and rebounded in the following hours. As a result, light crude gained 3.10% and invalidated earlier breakdown. What does it mean for oil bulls?
Yesterday, crude oil extended losses after the market’s open after U.S. government data showed the first monthly drop in gasoline demand in 14 months. Despite this drop, the commodity reversed and rebounded in the following hours on hopes that weekly inventories data would show smaller-than-expected increase in crude oil supplies as Friday’s Baker Hughes showed that the U.S. oil rig count dropped by another 10 to 362 (which was the lowest count since Nov 2009). Thanks to these circumstances, light crude invalidated earlier breakdown and closed the day above the previously-broken Fibonacci retracement. What does it mean for oil bulls? Let’s examine charts and find out (charts courtesy of http://stockcharts.com).
Quoting our previous Oil Trading Alert:
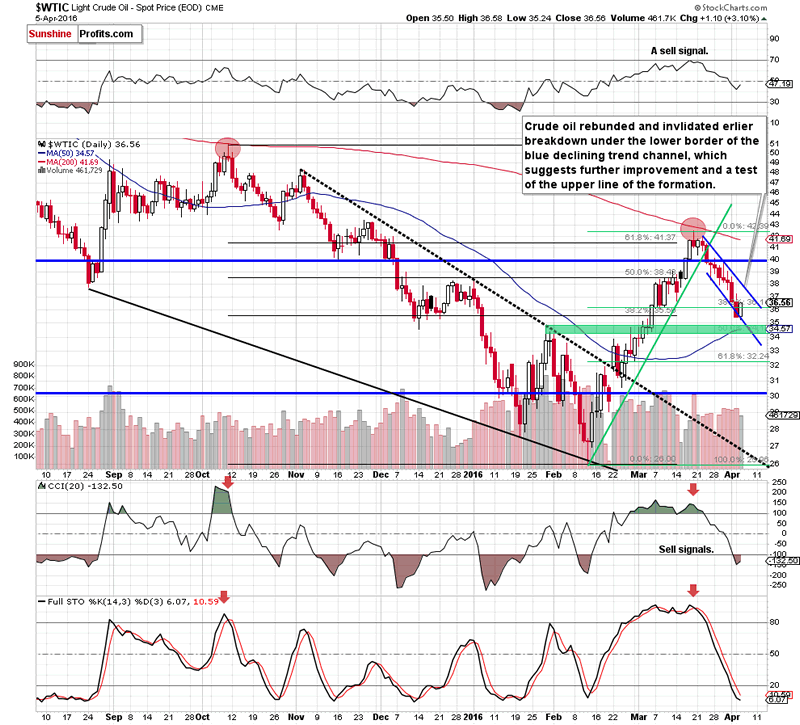
(…) the commodity (…) slipped under the lower border of the blue declining trend channel, which suggests that light crude will likely test the strength of the next support zone created by the Jan and late-Feb highs, the 50% Fibonacci retracement and the 50-day moving average in the coming days.
Nevertheless, taking into account the current position of the CCI and Stochastic Oscillator, it seems that the space for declines may be limited and reversal in the coming week can’t be ruled out. (…)However, such price action would be more reliable, if the commodity invalidates yesterday’s small breakdown under the lower border of the formation.
Yesterday, crude oil moved little lower after the market’s open, hitting an intraday low of $35.24. With this move, the commodity approached the green support zone, which was enough to encourage oil bulls to fight for higher levels. As a result, they pushed light crude above the lower border of the blue declining trend channel, invalidating earlier breakdown. This positive signal triggered further improvement and the commodity increased to $36.58, closing the day above the blue line.
Taking this positive fact into account, we think that light crude will extend gains in the coming day and we’ll see (at least) a test of the upper line of the blue declining trend channel (currently around $37.65).
Finishing today’s alert, please note that the American Petroleum Institute reported yesterday that crude oil inventories dropped by 4.3 million barrels and gasoline supplies declined 116,000 barrels at the end of last week. These encouraging numbers pushed crude oil’s futures higher in a pre-market trading, which suggests that the commodity will also increase after the market’s open.
Before we summarize today’s Oil Trading Alert, we would also like to draw your attention to the current situation in the U.S. dollar. Although the U.S. Department of Labor showed on Friday that non-farm payrolls rose more-than-expected, the greenback remains under pressure, making crude oil more attractive for buyers holding other currencies. Therefore, we think that it is also worth to keep an eye on today’s minutes from the Federal Reserve's latest meeting.
Summing up, crude oil closed yesterday’s session above the lower border of the blue declining trend channel and invalidated earlier breakdown under this line. This is a positive signal, which suggests that the commodity will test of the upper line of the blue declining trend channel (currently around $37.65) in the coming day(s).
Very short-term outlook: mixed with bullish bias
Short-term outlook: mixed
MT outlook: mixed
LT outlook: mixed
Trading position (short-term; our opinion): No positions are justified from the risk/reward perspective. We will keep you informed should anything change, or should we see a confirmation/invalidation of the above.
As a reminder – “initial target price” means exactly that – an “initial” one, it’s not a price level at which we suggest closing positions. If this becomes the case (like it did in the previous trade) we will refer to these levels as levels of exit orders (exactly as we’ve done previously). Stop-loss levels, however, are naturally not “initial”, but something that, in our opinion, might be entered as an order.
Since it is impossible to synchronize target prices and stop-loss levels for all the ETFs and ETNs with the main market that we provide this level for (crude oil), the stop-loss level and target price for popular ETN and ETF (among other: USO, DWTI, UWTI) are provided as supplementary, and not as “final”. This means that if a stop-loss or a target level is reached for any of the “additional instruments” (DWTI for instance), but not for the “main instrument” (crude oil in this case), we will view positions in both crude oil and DWTI as still open and the stop-loss for DWTI would have to be moved lower. On the other hand, if crude oil moves to a stop-loss level but DWTI doesn’t, then we will view both positions (in crude oil and DWTI) as closed. In other words, since it’s not possible to be 100% certain that each related instrument moves to a given level when the underlying instrument does, we can’t provide levels that would be binding. The levels that we do provide are our best estimate of the levels that will correspond to the levels in the underlying assets, but it will be the underlying assets that one will need to focus on regarding the sings pointing to closing a given position or keeping it open. We might adjust the levels in the “additional instruments” without adjusting the levels in the “main instruments”, which will simply mean that we have improved our estimation of these levels, not that we changed our outlook on the markets.
Thank you.
Nadia Simmons
Forex & Oil Trading Strategist
Przemyslaw Radomski
Founder, Editor-in-chief
Sunshine Profits: Gold & Silver, Forex, Bitcoin, Crude Oil & Stocks
Stay updated: sign up for our free mailing list today
* * * * *
Disclaimer
All essays, research and information found above represent analyses and opinions of Nadia Simmons and Sunshine Profits' associates only. As such, it may prove wrong and be a subject to change without notice. Opinions and analyses were based on data available to authors of respective essays at the time of writing. Although the information provided above is based on careful research and sources that are believed to be accurate, Nadia Simmons and his associates do not guarantee the accuracy or thoroughness of the data or information reported. The opinions published above are neither an offer nor a recommendation to purchase or sell any securities. Nadia Simmons is not a Registered Securities Advisor. By reading Nadia Simmons’ reports you fully agree that he will not be held responsible or liable for any decisions you make regarding any information provided in these reports. Investing, trading and speculation in any financial markets may involve high risk of loss. Nadia Simmons, Sunshine Profits' employees and affiliates as well as members of their families may have a short or long position in any securities, including those mentioned in any of the reports or essays, and may make additional purchases and/or sales of those securities without notice.
© 2005-2022 http://www.MarketOracle.co.uk - The Market Oracle is a FREE Daily Financial Markets Analysis & Forecasting online publication.