


Silver Lows – Silver Ratios
Commodities / Gold and Silver 2016 Mar 31, 2016 - 05:43 PM GMTBy: DeviantInvestor

 Silver prices as this is written (March 23) are down 60 cents on the day. Scary … no, probably a normal correction.
Yes, paper silver prices on the COMEX are “managed” for the benefit of traders, banks and others large enough to manipulate the prices. It makes sense that if a bank, which owns the regulators and can “work” the prices to their advantage … will do so.
The solution for small investors:
- Don’t trade in their game.
- Stack physical silver.
- Take a long term perspective and use the “crashes” to your advantage.
- Buy at lows.
HOW DO WE DETERMINE SILVER LOWS?
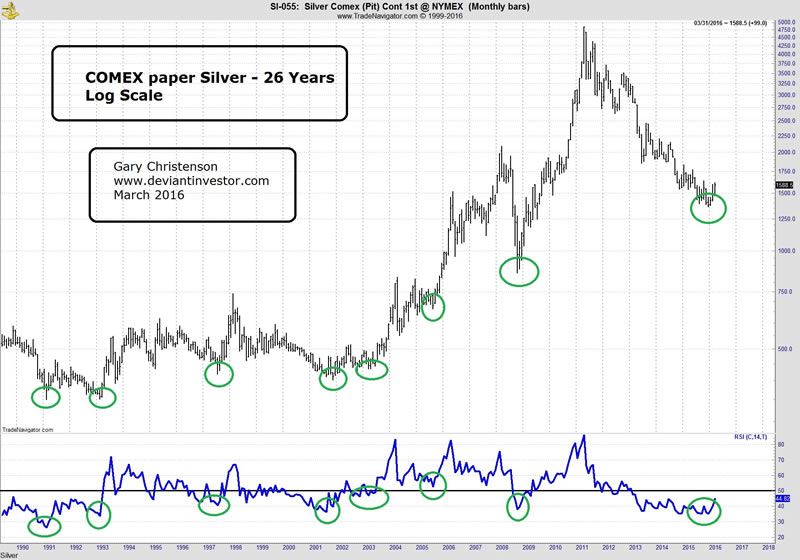
Examine the chart of COMEX paper silver prices on a log scale over 26 years. I have noted the eight most important lows – in my opinion – with green circles.
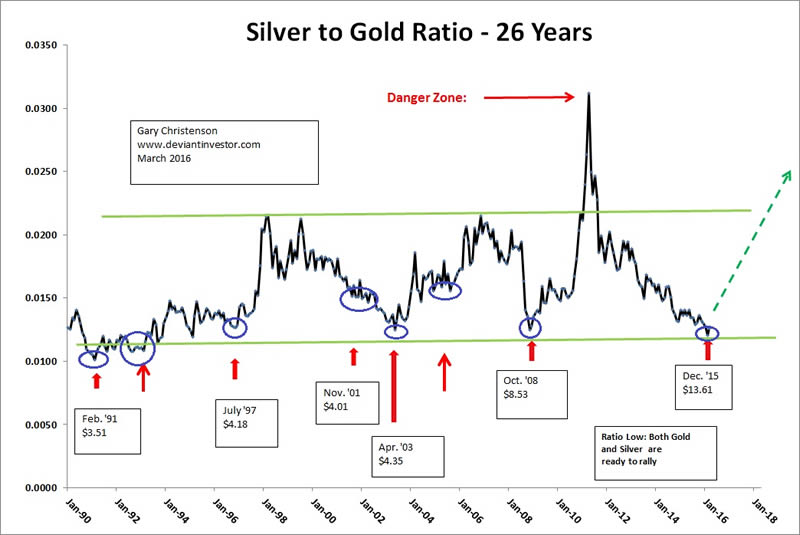
Examine the silver to gold ratio over the past 26 years. Lows in the ratio are good indicators of lows in the actual silver price. Note the purple circles that correspond with the lows in the above silver chart.
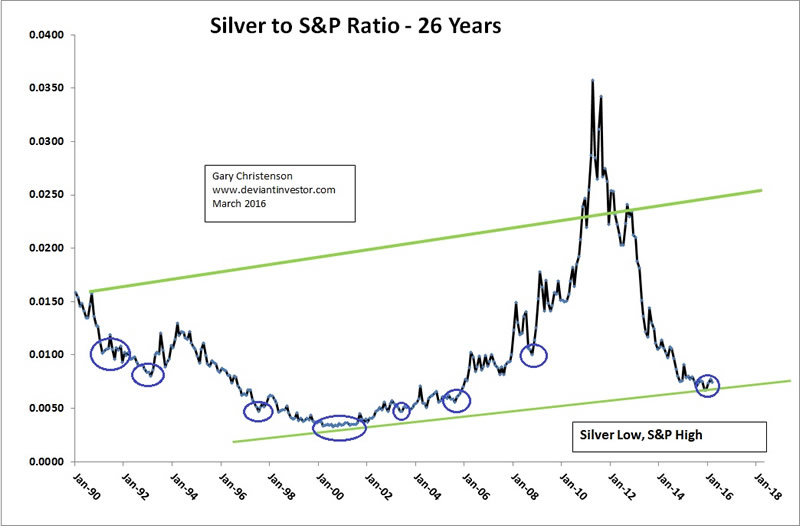
Examine the silver to S&P 500 Index ratio over the past 26 years. Lows in the ratio have generally indicated lows in the silver price. Note the purple circles that correspond with the lows in the above silver chart.
Examine the first chart of COMEX paper silver prices and note the Relative Strength Indicator (14 months) at the bottom of the chart, and note the green ovals. This timing indicator on long term charts accurately indicates silver lows.
The dates for the above silver lows are listed in the following table using monthly data:
Date Silver Lows Silver to Silver to RSI
Gold S&P 500
2/91 $3.50 2/91 2/91 – 12/91 2/91
2/93 $3.51 2/93 2/93 2/93
7/97 $4.18 5/97 7/97 7/97
11/01 $4.01 11/01-4/02 3/00-1/02 8/01
3/03 $4.34 5/03 5/03 3/03
8/05 $6.63 8/05 8/05 8/05
10/08 $8.53 11/08 10/08 10/08
12/15 $13.61 2/16 12/15 12/15
You can see that the ratio lows and the RSI were generally quite good at indicating major lows in the price of silver.
Yes, the powers-that-be can manipulate the prices of silver, gold, crude, the S&P, and T-bonds, but remember, “they” could not stop:
- The S&P from falling 57% between Oct. 2007 and March 2009.
- The housing crash, the crash of the CDO market, or the AIG derivative mess.
- The NASDAQ crash of 2000.
- The price of silver running from $8.53 in October of 2008 to nearly $50 in April 2011.
- The next S&P 500 and T-bond crash that is coming …
In my opinion, silver reached a bottom back in December 2015. The silver to gold ratio and the silver to S&P ratio support that conclusion. The RSI turned up in December. Anything can happen in “managed” markets, but 26 years of history indicate that silver bottomed in December.
Silver thrives, paper dies.
Gary Christenson
GE Christenson aka Deviant Investor If you would like to be updated on new blog posts, please subscribe to my RSS Feed or e-mail. My books on Amazon
© 2016 Copyright Deviant Investor - All Rights Reserved Disclaimer: The above is a matter of opinion provided for general information purposes only and is not intended as investment advice. Information and analysis above are derived from sources and utilising methods believed to be reliable, but we cannot accept responsibility for any losses you may incur as a result of this analysis. Individuals should consult with their personal financial advisors.
Deviant Investor Archive |
© 2005-2022 http://www.MarketOracle.co.uk - The Market Oracle is a FREE Daily Financial Markets Analysis & Forecasting online publication.