Silver’s Bullish Cup And Handle Pattern
Commodities / Gold and Silver 2016 Mar 30, 2016 - 07:32 AM GMTBy: InvestingHaven
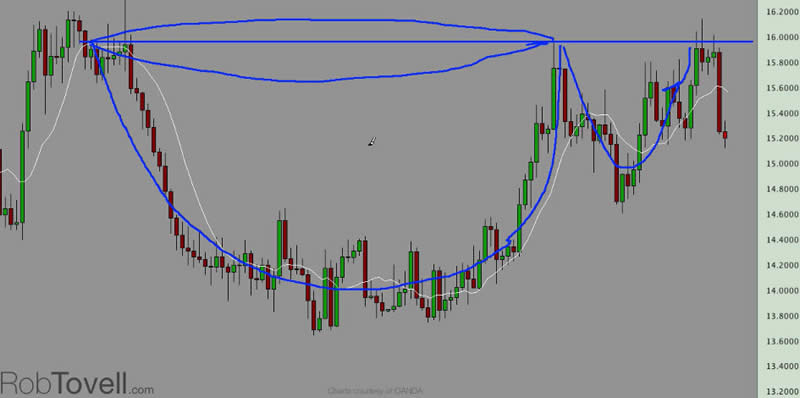
 Two months ago, we signaled a huge buying opportunity was setting up in gold. Basically, that observation was based on a bullish chart pattern which is known as a ‘cup and handle’. After our call, gold moved higher in an explosive way.
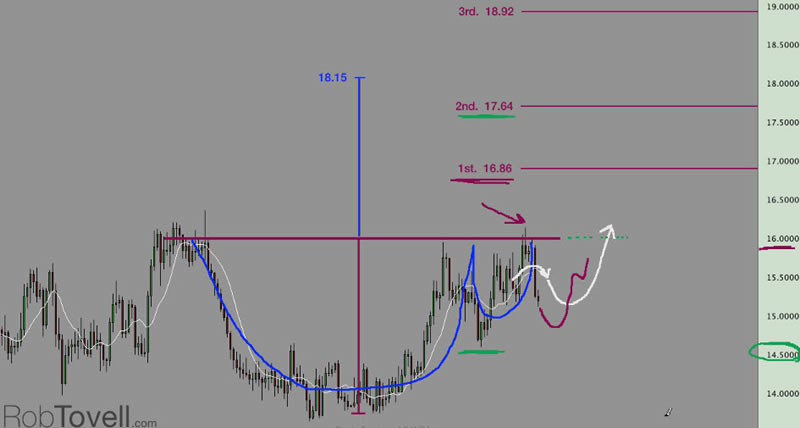
Today, we observe a similar chart formation on silver’s chart. The cup and handle resistance line comes in at $16 /oz.

As a result of the Brussels bombing, we saw money moving to the US dollar last week. Because of that, precious metals and commodities sold off. Sooner rather than later, however, the market will turn around and sell off those dollars, which is basically what happened today (Tuesday).
With that, a bounce in silver is likely, which would turn up the short term moving average. In doing so, the key to watch is the break through $16. As soon as that takes place, the first two price targets
The downside, however, is that those bullish price targets are not met, and a bearish scenario plays out. That is important in the context of risk management. The level to watch, in which the bullish scenario is invalidated, is $14.50 /oz.
From a technical point of view, the upside target is reflected by adding the value which represents the depth of the “cup” to the resistance line. That price target comes in at $18.15. Uncoidentally, that price level is similar to the second target explained above.

The most bullish (fourth) target is $21.32. However, it is not a short term target, as, usually, the first and second targets are quickly achieved, but the third and fourth targets take (much) more time to achieve, so it could take several months or a year before getting there.
Watch the video for the in-depth analysis on silver’s price targets and chart formation.
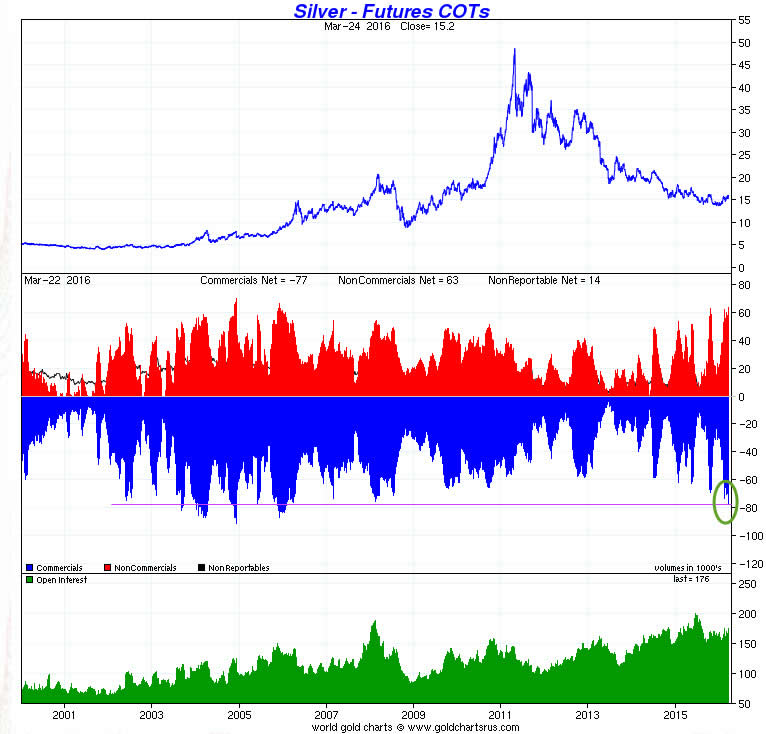
From a risk management perspective, we have to add a word of caution. As said, the bullish scenario outlined above will be invalidated once $14.50 is broken. There is a probability that it will happen, given the COMEX futures market positions of commercial traders. As seen on the chart below, one of our precious metals market indicators, short positions by commercial traders have reached the highest (most extreme) reading since 2006. If $14.50 is breached, then investors should let the bearish scenario unfold, and take the opportunity at lower prices, as that would provide much more upside to the upside targets calculated above.

Analyst Team
The team has +15 years of experience in global markets. Their methodology is unique and effective, yet easy to understand; it is based on chart analysis combined with intermarket / fundamental / sentiment analysis. The work of the team appeared on major financial outlets like FinancialSense, SeekingAlpha, MarketWatch, ...
Copyright © 2016 Investing Haven - All Rights Reserved Disclaimer: The above is a matter of opinion provided for general information purposes only and is not intended as investment advice. Information and analysis above are derived from sources and utilising methods believed to be reliable, but we cannot accept responsibility for any losses you may incur as a result of this analysis. Individuals should consult with their personal financial advisors.
© 2005-2022 http://www.MarketOracle.co.uk - The Market Oracle is a FREE Daily Financial Markets Analysis & Forecasting online publication.


