


BEA Revises U.S. GDP Economic Growth Upward to 1.38% for Q4 2015
Economics / US Economy Mar 25, 2016 - 01:56 PM GMTBy: CMI

 In their third and final estimate of the US GDP for the fourth quarter of 2015, the Bureau of Economic Analysis (BEA) reported that the economy was growing at a +1.38% annualized rate, up +0.38% from their previous estimate for the fourth quarter, but still down -0.61% from the third quarter.
The improvement was broadly based, with the revision to consumer expenditures for services having the greatest impact (+0.34%). Exports (+0.09%) and imports (+0.02%) also improved, as did commercial fixed investment (+0.04%) and governmental expenditures (+0.03%).
However economic growth provided by consumer spending on goods was revised downward still further, with the contribution to the headline growth dropping another -0.06%. And the contribution from inventories removed another -0.08% from the headline.
The BEA's treatment of inventories can introduce noise and seriously distort the headline number over short terms -- which the BEA admits by also publishing a secondary headline that excludes the impact of inventories. The BEA's "bottom line" (their "Real Final Sales of Domestic Product") was significantly improved in this revision, gaining +0.46% -- although it remains over a full percent lower than was reported for the prior quarter.
Annualized household disposable income was revised slightly downward in this report. Real annualized per capita disposable income was reported to be $38,303 per annum, down $17 from the previous estimate. The household savings rate was revised downward to 5.0% -- which is now unchanged from the prior quarter.
For this revision the BEA assumed an effective annualized deflator of 0.94%. During the same quarter (October 2015 through December 2015) the inflation recorded by the Bureau of Labor Statistics (BLS) in their CPI-U index was a very similar 0.93%. Slightly over estimating inflation results in slightly pessimistic growth rates, and if the BEA's "nominal" data was deflated using CPI-U inflation information the headline growth number would be a marginally better +1.41%.
Among the notable items in the report :
-- The headline contribution from consumer expenditures for goods was cut to +0.36% (down -0.06% from the earlier estimate and down -0.72% -- more than two thirds -- from the prior quarter).
-- The contribution to the headline from consumer services improved substantially to +1.30% (up +0.34% from the previous report and also up +0.34% from the third quarter). The combined consumer contribution to the headline number was +1.66%, down -0.38% (about one-fourth) from 3Q-2015.
-- The headline contribution from commercial private fixed investments remained minor at +0.06%, and down a material -0.54% from the prior quarter.
-- The contribution from inventories remained negative, subtracting -0.22% from the headline number. This was an improvement of +0.49% from the -0.71% recorded in 3Q-2015. It bears repeating that the BEA's inventory numbers are exceptionally noisy, subject to significant distortions/anomalies caused by commodity price swings while representing a zero reverting (and long term zero sum) series.
-- Governmental spending added +0.02% to the headline. This is down -0.30% from the prior quarter.
-- The contribution to the headline number from exports remained in contraction at -0.25% (up +0.09% from the previous estimate but down -0.34% from the prior quarter).
-- Imports generated +0.11% growth in the BEA's model of the economy, up some +0.02% from the previous report and up +0.46% from the prior quarter.
-- The "real final sales of domestic product" was up a significant +0.46% from the previous estimate, and is now reported to be growing at a +1.60% annualized rate. However, this remains down more than a full percent from the +2.70% in the prior quarter. This is the BEA's "bottom line" measurement of the economy and it excludes the reported inventory contraction.
-- As mentioned above, real per-capita annual disposable income was revised slightly downward by $17 in this report, while the household savings rate declined in concert with the softening incomes. It is important to keep this line item in perspective. Real per-capita annual disposable income is up only +4.43% in aggregate since the second quarter of 2008 -- a meager annualized +0.58% growth rate over the past 30 quarters. Meanwhile, according to Sentier Research, median incomes during the same time span have contracted by roughly 4%.
The Numbers, As Revised
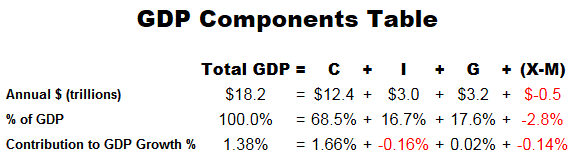
As a quick reminder, the classic definition of the GDP can be summarized with the following equation :
or, as it is commonly expressed in algebraic shorthand :
In the new report the values for that equation (total dollars, percentage of the total GDP, and contribution to the final percentage growth number) are as follows :
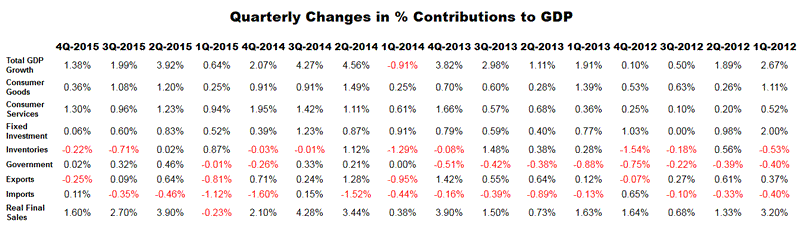
The quarter-to-quarter changes in the contributions that various components make to the overall GDP can be best understood from the table below, which breaks out the component contributions in more detail and over time. In the table below we have split the "C" component into goods and services, split the "I" component into fixed investment and inventories, separated exports from imports, added a line for the BEA's "Real Final Sales of Domestic Product" and listed the quarters in columns with the most current to the left :
Summary and Commentary
At face value this report shows the U.S. to be the healthiest and fastest growing major developed economy -- which perhaps says much more about the global situation than it does about the domestic environment. Sadly, seven consecutive quarters of measurable growth and back-to-back quarters of slightly more than anemic growth (> +1%) does provide serious global bragging rights. And when ignoring inventories (which is highly recommended) that domestic growth becomes almost respectable at +1.60%.
Peeking ahead, GDPNow from the Atlanta Fed is forecasting a very similar growth report for the first quarter of 2016 -- although that forecast has been tracking downward of late and is now below "consensus" expectations.
All of which frames nicely the dilemma faced by the Fed's FOMC -- a stable economy that appears to be neither contracting nor remotely in danger of overheating. Arguably a Goldilocks growth rate -- albeit obtained via unprecedented and sustained monetary stimulus that by all rights should have stimulated far more.
Given the domestic economic situation outlined above, we understand the Fed's hesitancy to raise rates. And we understand the delicacy of the global economic environment, which clearly has the economists at the Fed concerned. We also understand the Fed's pride when acting the part of senior member at the central banks club. We simply wonder why the Fed now believes that helping sustain the global economy is part and parcel of their charter and/or congressional mandate.
Consumer Metrics InstituteTM
Home of Daily Consumer Leading Indicators
http://www.consumerindexes.com
© 2016 Copyright Consumer Metrics Institute - All Rights Reserved Disclaimer: The above is a matter of opinion provided for general information purposes only and is not intended as investment advice. Information and analysis above are derived from sources and utilising methods believed to be reliable, but we cannot accept responsibility for any losses you may incur as a result of this analysis. Individuals should consult with their personal financial advisors.
© 2005-2022 http://www.MarketOracle.co.uk - The Market Oracle is a FREE Daily Financial Markets Analysis & Forecasting online publication.