Stock Market Drilling down to see what's going on
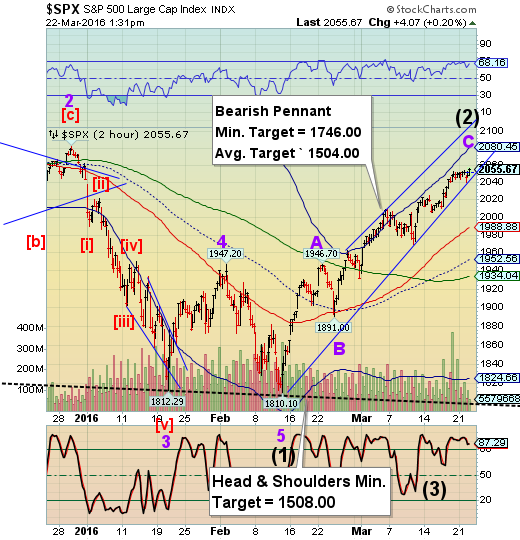
Stock-Markets / Stock Markets 2016 Mar 22, 2016 - 08:04 PM GMT Sometimes it helps to “drill down” to a smaller scale to see if we may make some sense out of where this rally may be leading us. The first thing to check is the Wave relationships. Wave A = Wave C at 2027.60. At this point, Wave C is 121% the size of A.
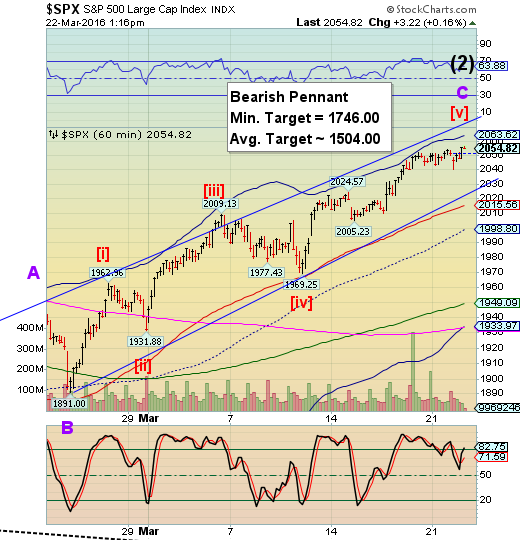
We drill down a little further and find that Wave [iii] is 107% the size of Wave [i]. Wave [iii] times 1.07 equals a target of 2052.18 for Wave [v]. That is why it is easy to mistake Wave b of (iv), which happened near yesterday’s close, as the probable top. It wasn’t, but now we appear to be getting closer in our calculation of the size of this rally. Let’s go a step further.

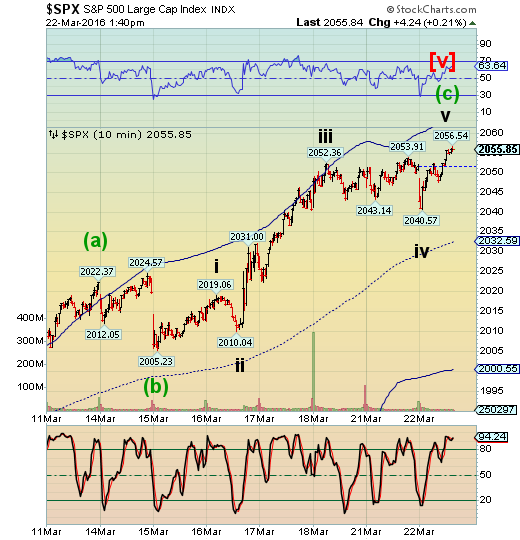
A 10-minute chart appears to be even more instructive. All of the Micro Waves appear to have an a-b-c construction. Wave v appears to be complete, as well. In this case, Wave iii is undoubtedly the largest wave, so we look for equality between Waves i and v. In this case, Wave v equals Wave I at 2054.40. As usual, Wave v overshot its target, but we have seen this before.

This 3-way check in a corrective rally can be helpful. Is it 100% accurate? No. Alternate patterns may interfere. However, should SPX decline back beneath 2040.00, we have a much higher probability of being correct.
VIX is revisiting its low again at 13.75. It is being sold against the rally in SPX.

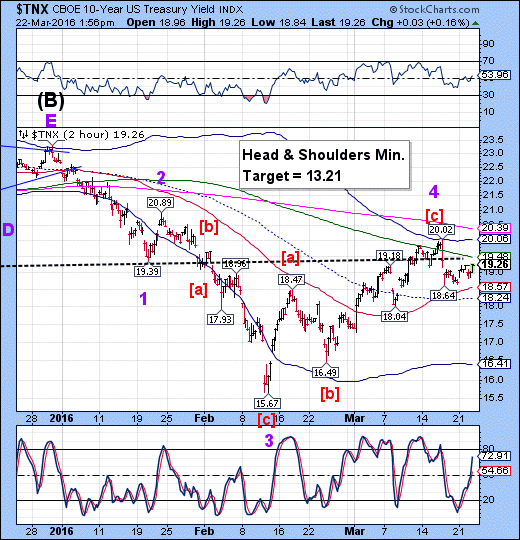
TNX went higher today at 19.26 against yesterday’s high of 19.24. Today is a Primary Cycle Pivot, so that may explain the additional 1-day wait for the decline to resume. This could be interesting.

Regards,
Tony
Our Investment Advisor Registration is on the Web.
We are in the process of updating our website at www.thepracticalinvestor.com to have more information on our services. Log on and click on Advisor Registration to get more details.
If you are a client or wish to become one, please make an appointment to discuss our investment strategies by calling Connie or Tony at (517) 699-1554, ext 10 or 11. Or e-mail us at tpi@thepracticalinvestor.com .
Anthony M. Cherniawski, President and CIO http://www.thepracticalinvestor.com
As a State Registered Investment Advisor, The Practical Investor (TPI) manages private client investment portfolios using a proprietary investment strategy created by Chief Investment Officer Tony Cherniawski. Throughout 2000-01, when many investors felt the pain of double digit market losses, TPI successfully navigated the choppy investment waters, creating a profit for our private investment clients. With a focus on preserving assets and capitalizing on opportunities, TPI clients benefited greatly from the TPI strategies, allowing them to stay on track with their life goals
Disclaimer: The content in this article is written for educational and informational purposes only. There is no offer or recommendation to buy or sell any security and no information contained here should be interpreted or construed as investment advice. Do you own due diligence as the information in this article is the opinion of Anthony M. Cherniawski and subject to change without notice.
Anthony M. Cherniawski Archive |
© 2005-2022 http://www.MarketOracle.co.uk - The Market Oracle is a FREE Daily Financial Markets Analysis & Forecasting online publication.


