


Silver Price About to Slump Lower
Commodities / Gold and Silver 2016 Mar 21, 2016 - 01:56 PM GMTBy: Clive_Maund

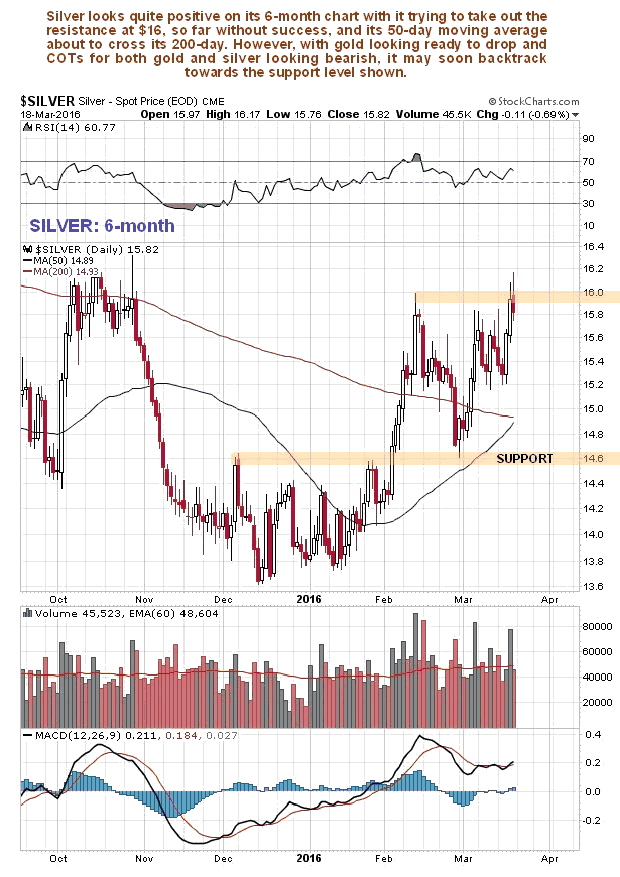
 Whilst silver had a good week last week, outperforming gold and rising to multi-month new high, it looks like that may have been its "swan song" for a while. It looks quite positive at first sight on its latest 6-month chart with the new high and moving averages starting to swing into a more positive alignment, but once you "look under the hood" you quickly realize things are not so good at all.
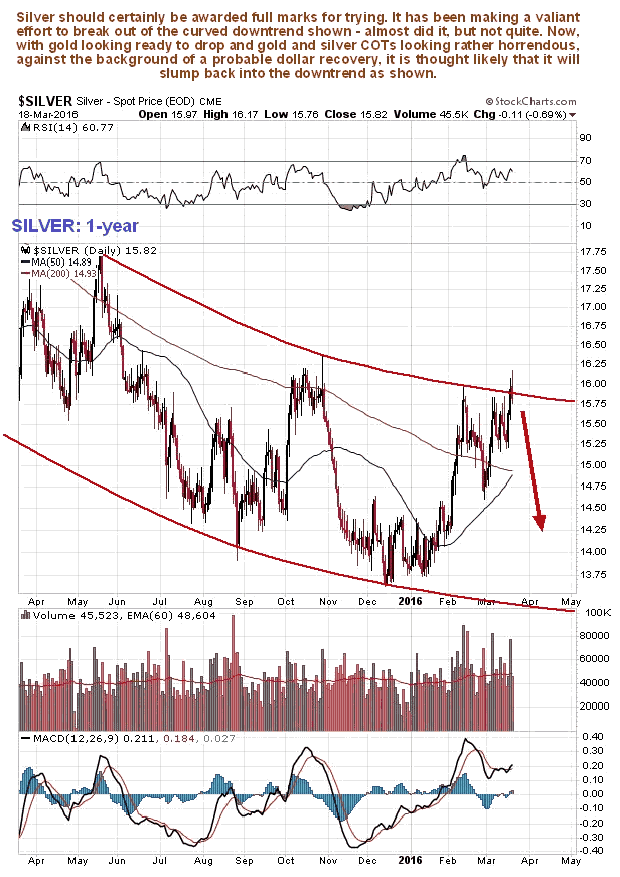
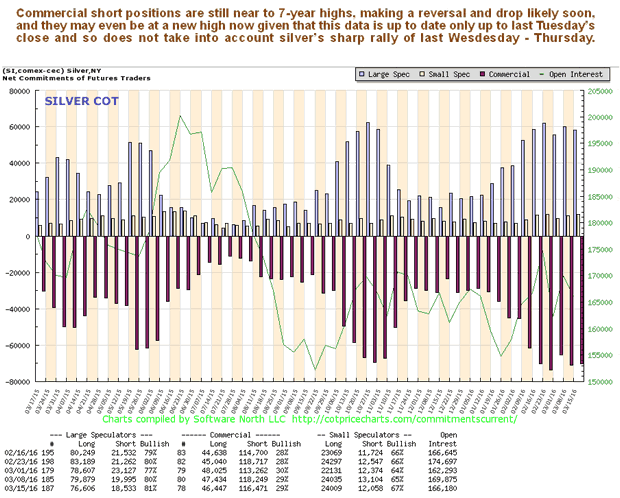
The 1-year chart does not look so hot. It shows silver trying to break out above the upper boundary of a curved downtrend, and not quite succeeding, thus making it vulnerable to slumping back across the channel again. The latest COT chart, which goes back a year, is placed beneath the 1-year silver chart for direct comparison. As we can see it looks pretty horrendous, with Commercial short positions up near to 7-year highs, which greatly amplifies the risks of silver now going into retreat again.
The long-term Hedgers chart, a form of COT chart, looks downright awful and flat out bearish...
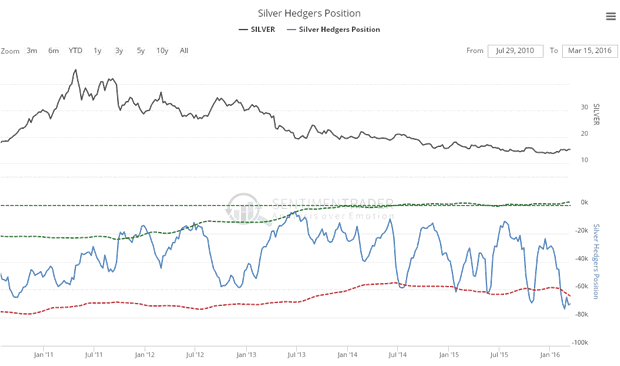
Chart courtesy of www.sentimentrader.com
The latest silver Optix, or optimism chart, looks much less threatening. It is in middling ground and in itself does not give us much clue what to expect one way or the other - we will have to go on other factors, which we are.
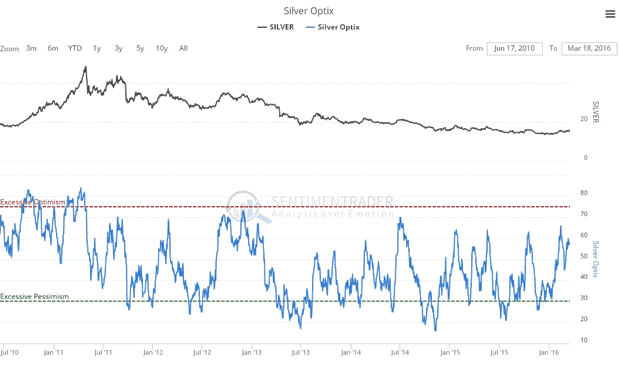
Chart courtesy of www.sentimentrader.com
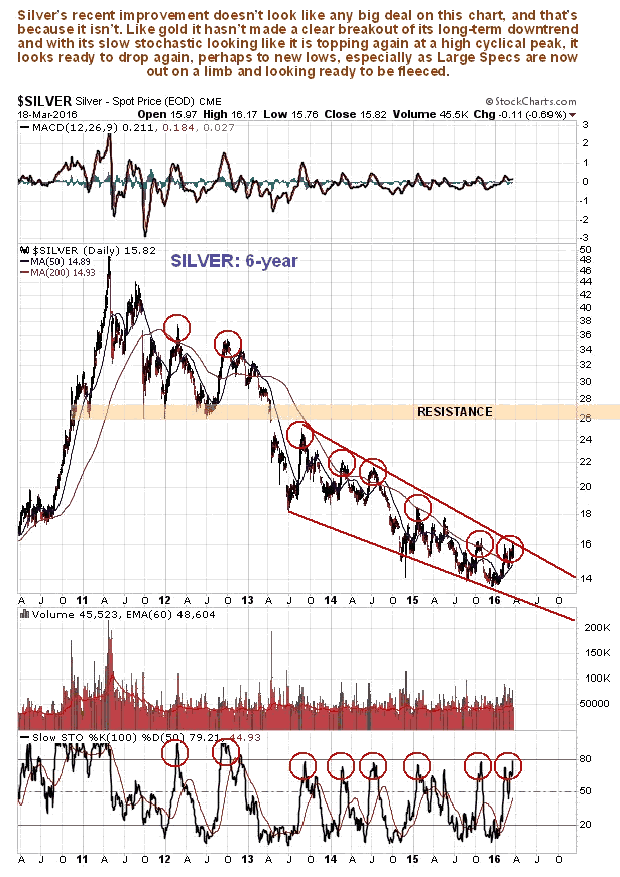
The 6-year chart quickly brings us right down to earth, it shows that silver has made less of an attempt to break out of its long-term downtrend than gold has. It is near the top of it and with its slow stochastic rolling over at a high cyclical peak, looks set to drop back again, possibly to new lows, and this risk is exacerbated by the now decidedly bearish looking COTs, which we just looked at, and the prospect for a near-term dollar rebound.
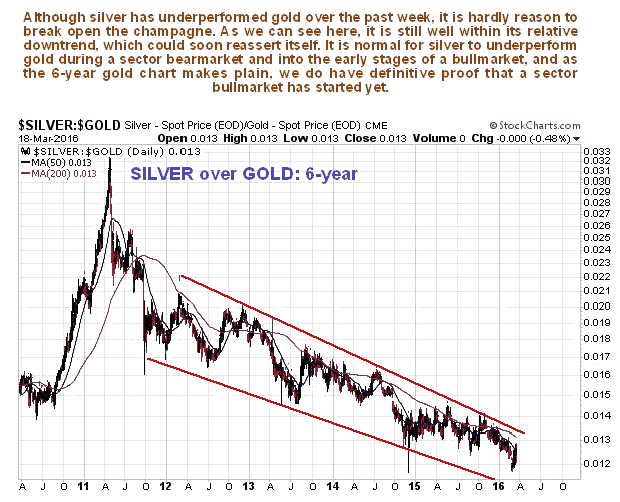
The 6-year chart for silver relative to gold shows that, even though silver had a flurry of outperformance last week, it is still well within its relative downtrend, which looks set to reassert itself shortly, increasing the chances of a silver reacting back quite hard.
Conclusion: although bugs are getting worked up and excited about its advance last week and attempt to break above $16, silver looks done here and set to slump back across its long-term downtrend channel.
By Clive Maund
CliveMaund.com
For billing & subscription questions: subscriptions@clivemaund.com
© 2016 Clive Maund - The above represents the opinion and analysis of Mr. Maund, based on data available to him, at the time of writing. Mr. Maunds opinions are his own, and are not a recommendation or an offer to buy or sell securities. No responsibility can be accepted for losses that may result as a consequence of trading on the basis of this analysis.
Mr. Maund is an independent analyst who receives no compensation of any kind from any groups, individuals or corporations mentioned in his reports. As trading and investing in any financial markets may involve serious risk of loss, Mr. Maund recommends that you consult with a qualified investment advisor, one licensed by appropriate regulatory agencies in your legal jurisdiction and do your own due diligence and research when making any kind of a transaction with financial ramifications.
Clive Maund Archive |
© 2005-2022 http://www.MarketOracle.co.uk - The Market Oracle is a FREE Daily Financial Markets Analysis & Forecasting online publication.