


Stock Market Pushing The Envelope
Stock-Markets / Stock Markets 2016 Mar 21, 2016 - 02:29 AM GMTBy: Andre_Gratian

 Current Position of the Market
SPX Long-term trend: Severe correction underway
SPX Intermediate trend: Rally pushing the envelope
Analysis of the short-term trend is done on a daily basis with the help of hourly charts. It is an important adjunct to the analysis of daily and weekly charts which discuss longer market trends.
Daily market analysis of the short term trend is reserved for subscribers. If you would like to sign up for a FREE 4-week trial period of daily comments, please let me know at ajg@cybertrails.com
PUSHING THE ENVELOPE
Market Overview
Last week, the market exceeded by a few points the boundaries proposed by the most valid base P&F count. That does not mean that our long-term market correction is over. Far from it! In P&F analysis, the most conservative count is the first to be considered. More often than not, this is the area where the prevailing rally or decline reverses. If, however, as it is the case today, we are tracking an exceptionally strong counter-trend rally, we can assign a more liberal count to the trend and, in that case, we come up with 2058, 2070, and perhaps even 2080 before we reach a reversal point. I am certain that some of the “bears” are getting a little nervous, especially those who went short too soon, but in my opinion, it is too early to regard this move as a new bullish uptrend. The SPX would have to go past 2116 before I would have a change of mind. In any case, P&F charting is only one tool, and no technical tool is 100% reliable. But collectively, technical tools are pretty efficient at determining the beginning and end of any trend. Let’s see what they tell us in the days ahead.
On the short-term, we cannot ignore the negative divergence in the hourly indicators, as we will see when we analyze the 60m chart. The odds that we are ready for a minor correction are very good. But more work needs to be done by their indicators before we can expect the weekly and daily trends to roll over. In all probability, this means that an attempt will be made to reach the levels mentioned above.
SPX Chart Analysis
Daily chart (This chart, and others below, are courtesy of QCharts.com.)
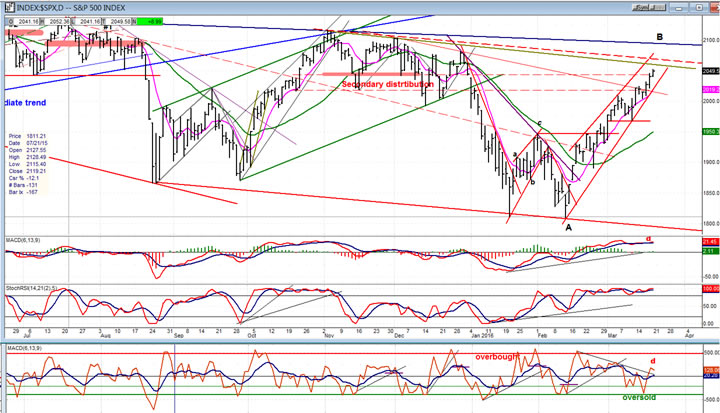
Nothing has changed in the structure! The index has progressed higher, but it has retained the wedge pattern. Since lately price has not been able to reach the top trend line of the wedge on each succeeding thrust, we have to consider this a form of deceleration. Another small detail: note that the last up-thrust (of the second set of threes from the last pull-back) has a smaller range, which is also a sign of deceleration, and we could count the entire progress from A to B as three successive a-b-c formations. Does that mean that the wedge is now complete? It all depends on what kind of correction we get from here. A minor top at Friday’s high is practically assured, but I would not swear that the entire formation has ended until we see some real selling taking place.
I have mistakenly called the thin red line across the second and third highs of the previous top formation the primary downtrend line. The correct main downtrend line is the heavy dark blue line. If we keep on going and manage to break above it, this will be the time for bears to start worrying. The dashed red line is a parallel to the line drawn across the two intermediate lows (August and January). The two lines form a channel which should contain prices, at least for now. So far, the two intermediate rallies look remarkably similar in structure and in price. Do we continue the pattern with a large distribution top before starting a downtrend? No way to tell at this time and we should not count on it. Looking at the price activity from the 2135 top in May, 2015, it’s no wonder that investors and analysts are confused about the nature of this correction. If we should make another decline which ends toward the bottom of the large red channel with another good rally following, it could be time to become neutral. If, on the other hand, we go much beyond the 1810 level on the next downtrend, it would confirm expectations for the continued retracement of the bull trend.
The A/D oscillator continues to show negative divergence. In the momentum indicators, the SRSI has returned to 100, so no divergence there, but the MACD does show some minor divergence by not being able to keep up with the price move. Surely that has to be some sort of warning that we are not going to keep moving much higher without a correction which could end the entire rally.
Hourly chart
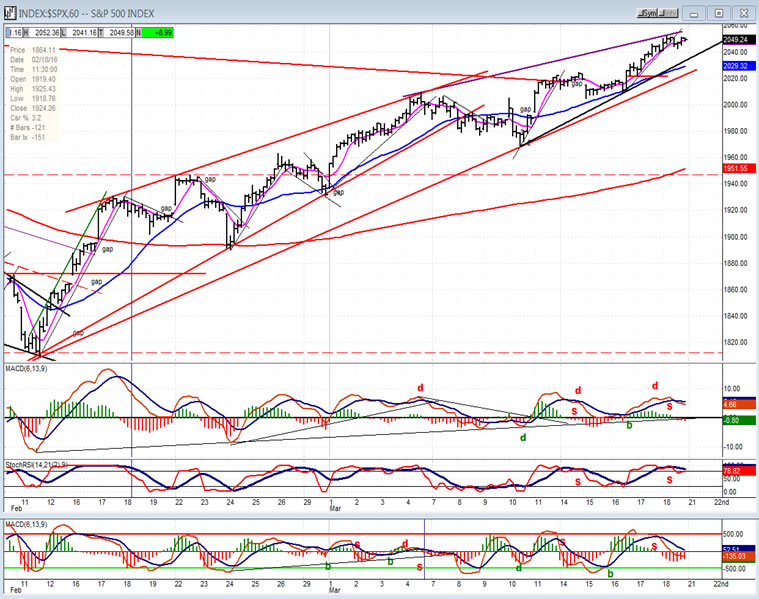
The 60m chart shows the original wedge pattern which appeared to come to an end until the Fed toned down its expectation for interest rate increases this year. This gave the index a second wind which pushed prices higher. At the same time, the dollar tanked, causing oil to extend its rally and providing additional buying rationale. But with a new top trend line ostensibly angling over (another sign of deceleration), it’s now a question of whether traders will be satisfied with that extra push or if they go for one more high after a minor correction.
The indicators show that we are ready to pull back. Not only has negative divergence appeared, but the two momentum indicators have already made a bearish cross in their moving averages. We’ll see how much weakness ensues. If we manage to correct below the red wedge line, it could mean that we have a reversal of the trend from 1810, especially since this would ostensibly trigger a sell signal in the daily indicators
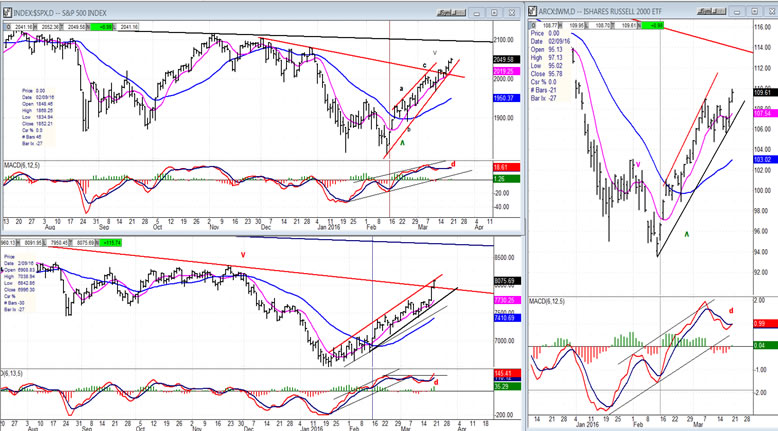
- SPX vs. TRAN (Dow Jones Transportation average) and IWM (Russell 2000 ETF)
- Both Tran and IWM had been diverging from SPX when it made a new high, but in the last three days they’ve quickly caught up. Not sure what it means. Will we have to wait for divergence to re-appear before we can expect a top, or was this a little spurt of short-covering which could have caused a little climactic top. We’ll soon find out. In any case, only the SPX has a bearish wedge formation. The other two are moving in normal channels.
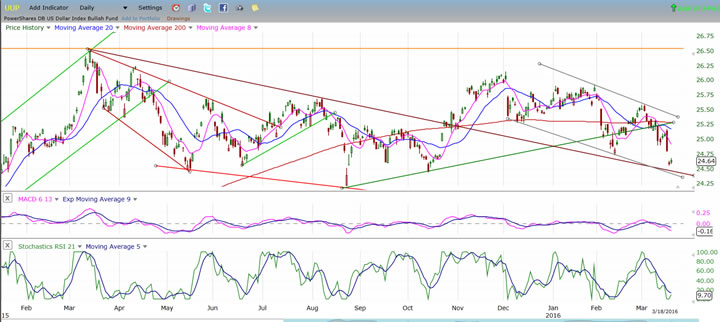
UUP (dollar ETF)
The dollar took a big hit when the Fed voiced its dovish intentions, but the decline may be short-lived. As long as it can consolidate where it is and not decline anymore, UUP will be in a position to start another uptrend. Dropping below the two trend lines, however, would put it deeper in the hole and less likely to make a new high anytime soon.
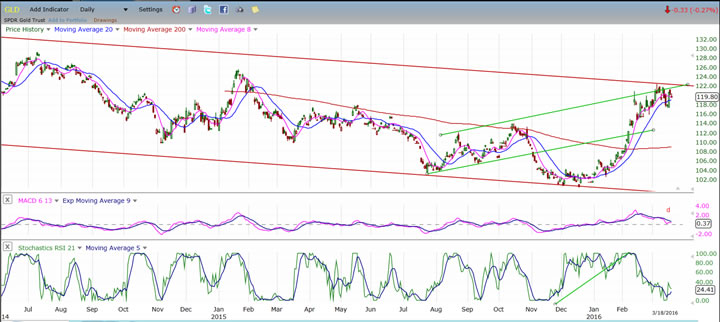
GLD has two cycle tops in this area: a 19-wk cycle which bottoms in the middle of next month, and a 25-wk cycle which bottoms in about 12 weeks. That should prevent it from making more upside progress over the short-term, unless the structure dictates a 5th wave for the move which started at 100.
GLD (gold ETF)
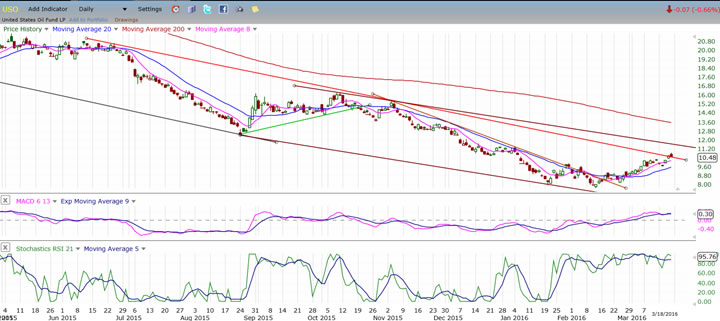
USO (US Oil Trust)
USO received some help recently from the plunge of the dollar as well as from the oil producers trying to find a way to stop oil prices from dropping lower. Technically, USO had a near-term move to about 10.50 which has now been reached and, after a minor correction, will have another potential move to 12. If the producing countries manage to reach some sort of agreement, this could help USO to reach that projection. However, it may be difficult to bring them to a consensus.
Summary
After Friday’s action, SPX looks poised for a minor pull-back. That may be all we get unless we can retrace below 2020, in which case a more important top may be in place. In spite of the continued market strength, there is no need to alter the view that we are correcting the recent bull market trend.
Andre
FREE TRIAL SUBSCRIPTION
If precision in market timing for all time framesis something that you find important, you should
Consider taking a trial subscription to my service. It is free, and you will have four weeks to evaluate its worth. It embodies many years of research with the eventual goal of understanding as perfectly as possible how the market functions. I believe that I have achieved this goal.
For a FREE 4-week trial, Send an email to: info@marketurningpoints.com
For further subscription options, payment plans, and for important general information, I encourage
you to visit my website at www.marketurningpoints.com. It contains summaries of my background, my
investment and trading strategies, and my unique method of intra-day communication with
subscribers. I have also started an archive of former newsletters so that you can not only evaluate past performance, but also be aware of the increasing accuracy of forecasts.
Disclaimer - The above comments about the financial markets are based purely on what I consider to be sound technical analysis principles uncompromised by fundamental considerations. They represent my own opinion and are not meant to be construed as trading or investment advice, but are offered as an analytical point of view which might be of interest to those who follow stock market cycles and technical analysis.
Andre Gratian Archive |
© 2005-2022 http://www.MarketOracle.co.uk - The Market Oracle is a FREE Daily Financial Markets Analysis & Forecasting online publication.