


US Dollar Important Chart
Currencies / US Dollar Mar 17, 2016 - 12:08 PM GMT

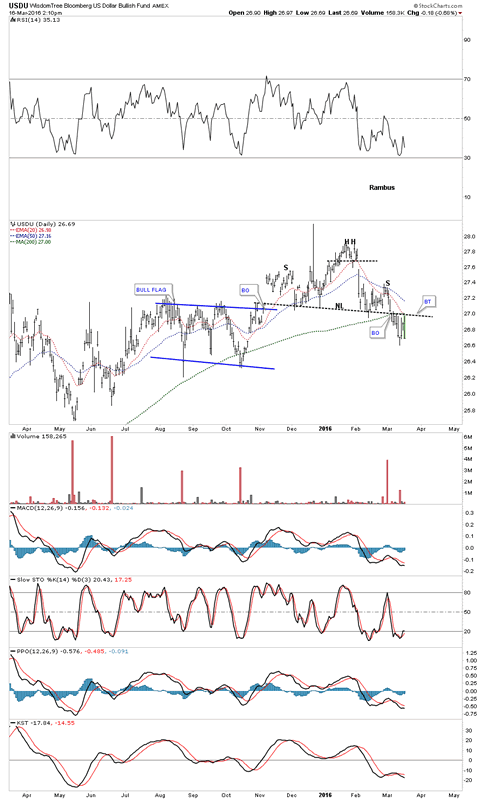
 Last week I showed you this potential H&S top forming on the USDU which is a more evenly balanced index for the US dollar which actually trades as an ETF.
http://www.wisdomtree.com/etfs/fund-details-currency.aspx?etfid=91
I built this chart using a line chart and then leaving the trendlines in place I converted to a bar chart. As you can see it has been backtesting the neckline for the last week or so along with the 200 dma. This chart shows a reversal pattern which sets up a downtrend of some kind. This is an important development.
Wisdom Tree Bloomberg US Dollar Bullish Fund Daily Chart
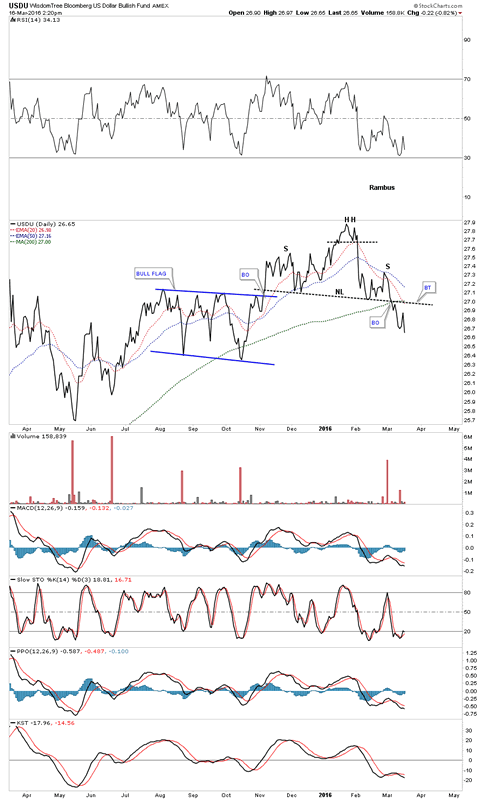
Below is the exact same chart shown as a line chart. Note how much cleaner the trendlines look.
Wisdom Tree Bloomberg US Dollar Bullish Fund Daily Chart 2
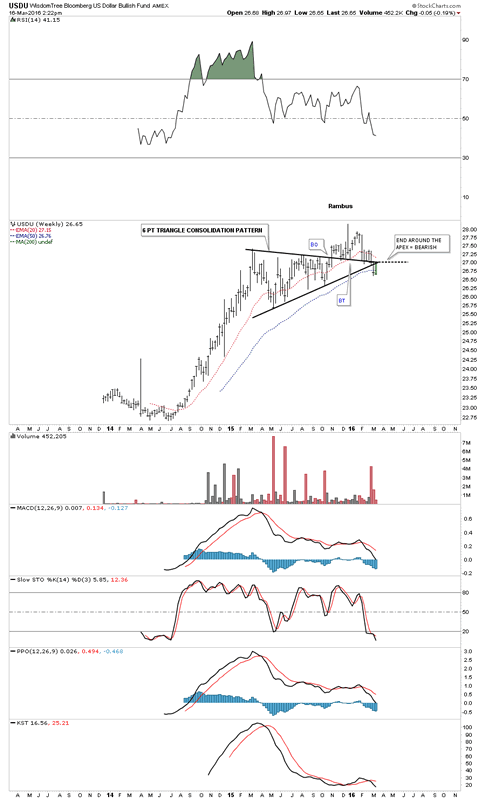
The weekly chart shows an end around the apex move which is also bearish.
Wisdom Tree Bloomberg US Dollar Bullish Fund Weekly Chart
All the best
Gary (for Rambus Chartology)
© 2016 Copyright Rambus- All Rights Reserved
Disclaimer: The above is a matter of opinion provided for general information purposes only and is not intended as investment advice. Information and analysis above are derived from sources and utilising methods believed to be reliable, but we cannot accept responsibility for any losses you may incur as a result of this analysis. Individuals should consult with their personal financial advisors.
© 2005-2022 http://www.MarketOracle.co.uk - The Market Oracle is a FREE Daily Financial Markets Analysis & Forecasting online publication.