


Credit Crisis Easing? Is the Stocks Bear Market End?
Stock-Markets / Credit Crisis 2008 Jul 13, 2008 - 06:31 PM GMT

 “In a sign of some improvement in the credit crisis, Wall Street firms for the first time didn't borrow from the Federal Reserve's emergency lending program and commercial banks also scaled back.
“Investment firms didn't draw such loans for the week ending July 9. They borrowed just $1.7 billion in the previous week ending July 2, down from $6.1 billion in the week before that. Such borrowing rose as high as $38.1 billion in early April.
“The Fed opened its emergency program to investment firms on March 17. At that time, the investment houses were given similar loan privileges as commercial banks after a run on Bear Stearns pushed the nation's fifth-largest investment bank to the brink of bankruptcy.
“Banks, meanwhile, averaged $12.9 billion in daily borrowing over the past week. That compared with $14.9 billion in the previous week.
“The identities of commercial banks and investment houses are not released.”
Yahoo News: Investment firms don't draw emergency loans Source: Jeannine Aversa, Yahoo News , July 10, 2008.
Financial Times: Banks find way to cushion losses
“Banks are set to cushion the blow of more credit-related losses by using an accounting rule that enables them to record exceptional gains when their financial health deteriorates.
“The method, which has allowed US and European banks to add more than $8 billion in paper profits, faces increasing opposition from investors, analysts and credit rating agencies.
“Under the rule, introduced in February 2007 after lobbying from banks, financial companies are allowed to use ‘mark to market' accounting on their own debt. As a result, if the price of their bonds and notes falls, banks can record a gain equal to the difference between the original value of the debt and its market price.
“In past months, the rule has helped banks including Lehman Brothers, Citigroup, Goldman Sachs, Morgan Stanley and Merrill Lynch to boost profits.
“Analysts forecast that Merrill and Citi, which report second-quarter results next week, will offset part of their expected multibillion-dollar writedowns with these gains. The impact of the accounting rule could be muted by a brief rally in debt markets in April.
“Critics, such as David Einhorn, the hedge fund manager who has been shorting Lehman shares, say the rule lets banks record accounting gains when sentiment towards the companies worsens.
“Holly Barker, a project manager at the Financial Accounting Standards Board, said companies that elect to use fair value for their debt have to quantify the reasons why its creditworthiness is declining.”
Source: Francesco Guerrera and Ben White, Financial Times , July 8, 2008.
Bloomberg: Toxic CDO's given up for dead coming to life with pension funds
“Collateralized debt obligations that helped drive banks to $400 billion of writedowns and credit losses are finding buyers under a different name: Re-Remics.
“Goldman Sachs Group, JPMorgan Chase and at least six other firms are repackaging unwanted mortgage bonds as sales of CDOs composed of asset-backed securities fall to less than $1 billion this year from $227 billion in 2007 because of the global credit crunch. Re-Remics contain parts that are structured to guard against higher losses on underlying loans than most CDOs, allowing holders to sell or retain other sections at lower prices that can translate to potential yields of more than 20%.
“‘It's just the reincarnation of the CDO,' said Paul Colonna, who manages more than $100 billion as chief investment officer for fixed income at GE Asset Management in Stamford, Connecticut. ‘The mechanics are the same, but you're getting in at a much different level of valuation.'
“Re-Remic stands for ‘resecuritizations of real estate mortgage investment conduits', the formal name of mortgage bonds. Sales of the securities may help revive the market for new home-loan debt, according to Bernard Maas, an analyst in New York at credit-rating firm DBRS Ltd.”
Source: Bloomberg , July 8, 2008.
Bloomberg: TIPS flunk inflation test as fuel, food overtake CPI
“Treasury Inflation Protected Securities aren't living up to their name for bond investors who say they can't trust the way the US government calculates the rising cost of consumer goods.
“Morgan Stanley, the second-biggest securities firm, and FTN Financial, a unit of Tennessee's largest bank, are telling clients to pare holdings of TIPS, whose principal amount rises with the Labor Department's consumer price index. Morgan Stanley says derivatives tied to inflation expectations are a better bet, while FTN recommends corporate and agency bonds because the index doesn't reflect the actual rate of US inflation.
“The $500 billion TIPS market's 5% returns this year have beat a 2.2% gain for Treasuries, according to Merrill Lynch indexes. TIPS should pay more, because the consumer price index downplays the 39% increase in gasoline and a 133% rise in corn in the past year, investors say. Yields on TIPS relative to Treasury debt, a gauge of traders' inflation bets, barely changed over the past 18 months even as consumer expectations for prices climbed to 3.4%, the highest since 1995.
“‘The consumer price index underestimates inflation,' said Jeremy Wolfson, who oversees $8.5 billion as chief investment officer at the City of Los Angeles Department of Water and Power Pension Fund. ‘Whether TIPS are adding a true inflation hedge, that's arguable based on the CPI component of it.'
“TIPS pay a lower coupon than Treasuries because investors expect the inflation adjustment on the principal to make up the difference. Traders who expect inflation to increase bet that the gap, or spread, between yields on TIPS and Treasuries will widen. The bigger the so-called breakeven rate, the greater traders' expectations that prices will go up.”
Source: Sandra Hernandez, Bloomberg , July 8, 2008.
John Authers (Financial Times): A decade of no returns
“It's official: US stocks have had a wasted decade. The real return on the S&P 500 since 1998, after subtracting consumer price inflation, is just below zero. The last time this was true, according to Merrill Lynch, was in 1983.
“Equities have been a terrible asset class over that period. Commodities had exciting returns, something everyone is now acutely conscious of, while bonds and cash at least beat inflation.
“Merrill's Richard Bernstein says the era of ‘loose money' that began in 1998 when the Federal Reserve cut rates to aid the bail-out of Long-Term Capital Management is proved to have led to ‘money illusion, not real returns'. It is impossible to disagree.
“Does this weaken the case for stocks? Not really. There are plenty of precedents for a decade in which stocks fail to beat inflation.
“According to research by academics at the London Business School, the US has to suffer six more years of negative real returns before it matches its record. From 1900 to 1916, US stocks dropped 6% in real terms. This slump lasted longer in the UK, where real returns were negative until 1922, and longer still for those nations worst affected by the second world war – France, Germany and Japan had negative returns from 1900 into the 1950s. Stocks outside the US fell 11% in real terms from 1928 to 1950.
“In spite of long periods in the doldrums, stocks are a better long-term inflation hedge than anything else. From 1900 to 2007, their real return was more than double that on bonds in every country the academics surveyed. They are riskier than bonds, but over time, investors will be compensated for the risk.”
Source: John Authers, Financial Times , July 8, 2008.
Barry Ritholtz (The Big Picture): Markets after big one-month declines
“Welcome to a new quarter, back from the long holiday weekend, and to the start of another earnings season.
“There are many cross currents going on, and today we want to review one in particular. What happens after markets suffer very large one-month declines.
“Several words of caution are due first: Traders can get into trouble when extrapolating. This is especially true when dealing with relatively small data sets, and fifteen examples over 2/3rds of a century certainly qualifies as small. Additionally, the causation/correlation issue arises especially in small samples (random or truly causative?)
“Caveats aside, let's have a look at the 15 prior biggest one-month Dow selloffs. As the chart below shows, we often see a healthy snap-back after significant one-month sell offs six and 12 months later. Except when we don't, such as 1973 and 2001, where we see even larger losses one year later.
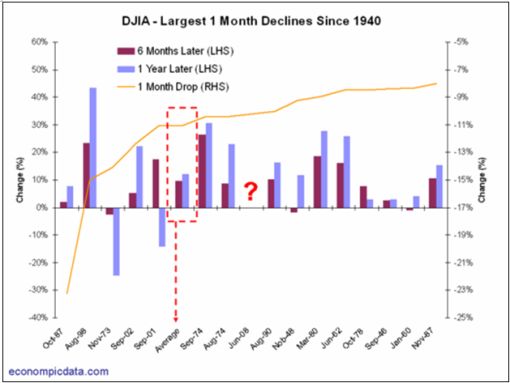
“What does this mean for traders? Well, if 13 out of 15 sounds like good odds to you, then you will be tempted to play this sell-off for a bounce.
“Perhaps adding another layer of questions to your analysis might be helpful. Is the current environment – high inflation and oil prices, modest growth, large write-downs and profits declining from a peak measure, and relatively low fear levels – more similar to 1973 and/or 2000, or is it closer to the other 13 periods?
“Answer that question and you have your trade.”
Source: Barry Ritholtz, The Big Picture , July 7, 2008.
Richard Russell (Dow Theory Letters): There is still too much complacency
“(1) There's still too much complacency. Many commentators are saying that the market is at a major bottom. Many analysts are talking about stocks being on the bargain counter – most are offering lists of stocks to buy. This isn't the atmosphere I'd expect if we're moving into a major market bottom.
“On a short-term basis the stock market is severely oversold. We should be close to some kind of a short-term rally. This could dovetail with a short-term correction in the price of oil.
“(2) The D-J Transports are still holding above their January 17 low of 4,140.29. I have no idea whether the Transports will continue to hold or not. It would be a huge plus if the stock market can become extremely oversold (in a major way) while the Transports are still holding above 4,140.29, but I'm beginning to doubt whether that's going to happen.
“(3) I can't get the October-November time period out of my mind. So many major declines have ended during October-November, I'm wondering if this decline is going to end during the fourth quarter as so many others have.
“(4) The 1942 and 1949 major bear market lows ended with the Lowry's Buying Power Index and Selling Pressure Index about 100 points apart with Selling Pressure the dominant Index. The brutal 1974 market bottom ended with the two indices 250 points apart. Currently, Selling Pressure is over 520 points above Buying Power, and I imagine today's greater volume and more stocks traded is partly responsible for the higher figure. At any rate, this is the largest negative spread in the 75 years of Lowry's.
“Still, it's amazing that the spread between Buying Power and Selling Pressure is now so huge. And it is still widening. Logically, somewhere ahead the spread must terminate – every trend has its limit. And at that ‘limit' point, the stock market will have reached its long-sought bottom.
“How will we recognize that bottom? One way is that following a final wash-out, the tide will turn, and the big institutional money will rush back into the market. This will often produce a 90% up-day. At that juncture, we will see heavy volume on the upside. The whole tenor and feel of the market will change. We're not there yet.
“(5) I have no idea what might set off or cause any future bull market. It might even be basically a foreign bull market which simply ‘rubs off' on the US. I don't know how it might work. I just think that somewhere ahead a new mighty bull market is waiting. But, of course, we have to get through this current bear market first. And so far, there's little to suggest that the bear market is over.”
Source: Richard Russell, Dow Theory Letters , July 7, 2008.
Richard Russell (Dow Theory Letters): Market's bottoming process could take several years
“I talked to Paul Desmond (head man at Lowry's) yesterday. He said that one reason for the huge spread between the Selling Pressure Index and the Buying Power Index (compared with spreads in the past) has to do with the massive increase in NYSE volume over recent years.
“Paul also offered the opinion that the lows of this market maybe take place over an extended period of time such as the extended low base of 1980 to 1982. And I agree with Paul – I've been thinking the same thing. The problems now imbedded in the US (and the world) economies are so severe that it could take several years of a bottoming process before the next bull market can get started.”
Source: Richard Russell, Dow Theory Letters , July 11, 2008.
David Fuller (Fullermoney): Stock markets – wait for banks to bottom out
“From my perspective, the USA remains the epicentre of financial risk. This does not negate the point that there are some superb American companies, particularly among the multinationals, and that valuations have improved somewhat. Until the US bank indices bottom out, I will remain wary, oversold and short covering induced technical rallies aside. I fear that the potential for US economic growth has been impaired, and … I do not see why the USD should recover against this background, which will almost certainly include at least a semi-nationalisation of Fannie Mae and Freddie Mac.
“Meanwhile, the biggest improvement in valuations is occurring in Asia's high-bet markets. They too have problems (doesn't everyone, perpetually, to a greater or lesser degree?) but these pale compared to what we are seeing in the west, in my view.
“I know where I would rather invest, and 50% plus declines by Asian indices look to me like an invitation for investors. Tactically, I would nibble on weakness in anticipation of medium to longer-term recoveries.
“Meanwhile, concern over the US dollar's problems, and those of many other fiat currencies, continue to underpin the investment appeal of gold.”
Source: David Fuller, Fullermoney , July 11, 2008.
Bloomberg: Darst of Morgan Stanley says stocks to fall another 10%
“David Darst, who helps oversee $734 billion as chief investment strategist at Morgan Stanley Global Wealth Management, talks with Bloomberg's Carol Massar in New York about the outlook for the US stock market and economy, corporate earnings and investment strategy.”

Source: Bloomberg , July 7, 2008.
SmartMoney: Bear Market – Where do we go from here?
“Leuthold Group last week, in the context of a ‘neutral' market view, told clients: ‘Our valuation models are indicating that there is not a huge amount of downside risk.' Since 1945, the firm said, ‘70% of all bear markets bottomed out with P/E ratios around the historical median of 17.3-times normalized earnings.' The market P/E on Leuthold's ‘normalized' profits was 17.3 at June 30.
“Normalized and median precedents and 70% tendencies can be useful. But they don't help in preventing those overshoots.”
Source: SmartMoney , July 7, 2008.
John Authers (Financial Times): Corporate earnings – worst is yet to come
“John Authers says that earnings of the MSCI World companies have fallen 3%, but the worst is yet to come.”
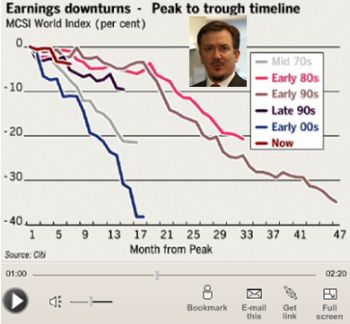
Click here for the text version of this article.
Source: John Authers, Financial Times , July 9, 2008.
Jeffrey Saut (Raymond James): Great time to be an investor
“We began this week's report with a quote from The Wall Street Journal that read, ‘The nerves mean not panicking or getting swayed by fear, at the bottom, or greed, at the top.' Last November we wrote about the Dow Theory ‘sell signal' when prices were high yet participants wanted to ‘buy'. Now we are writing about the Dow Theory downside non-confirmation and prices are low yet participants want to let stocks ‘go' (read: sell stocks).
“Meanwhile, it is session 33 in the ‘selling stampede', our proprietary oversold indicator is more oversold than it was at the March 2003 ‘low' (we were bullish there as well), the spread between Lowry's Buying Power Index (demand) and Lowry's Selling Pressure Index (supply) is the widest in the 75-year history of Lowry's (indicating that stocks are severely oversold), corporate insiders' selling is at rock-bottom lows, and we are seeing numerous indices not confirming the D-J Industrial's ‘downside dive'.
“It's not that we are turning aggressively bullish, but we think that unless the markets are in ‘crash mode' it is time to consider a corrective stock market rally as B.J Thomas warms up in the wings with the song ‘Raindrops'.”
Source: Jeffrey Saut, Raymond James , July 7, 2008.
CNBC: A bullish outlook, says UBS's Bianco
“The S&P will rise 25% in the second half of this year, according to David Bianco, chief equity strategist at UBS. He discusses his bullish outlook with CNBC's Maria Bartiromo.”
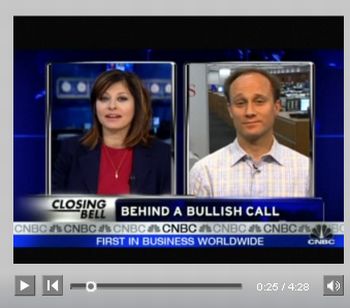
Source; CNBC , July 7, 2008.
Paul Kedrosky (Infectious Greed): Dow Jones returns by president
“People seem to be in a historical frame of market mind this weekend, so here is a chart of Dow Jones index returns by US president since Herbert Hoover obtained office in 1929. Note that I have given this result in compound annual terms to compensate for the differing lengths of presidential terms over the period.
“As an aside, while President Bush is currently running neck-and-neck with Jimmy Carter for the third-worst presidential market returns in history, President Bush is the leader of the pack as far as worst market returns go for two-term US presidents.”
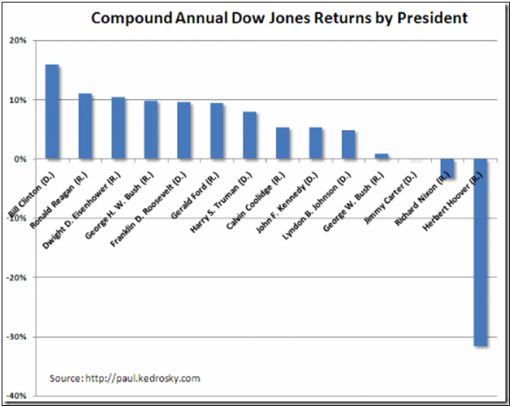
Source: Paul Kedrosky, Infectious Greed , July 4, 2008.
Bloomberg: China bulls wrong; stock rout to worsen, says Faber
“Investors betting on a rebound in China's tumbling stocks are setting themselves up for more losses, according to Marc Faber, who told investors to bail out of US stocks before 1987's so-called Black Monday crash and correctly predicted last August the US would enter a bear market.
“Faber's forecast contrasts with local stock analysts, who are as bullish as ever even after a 51% plunge in the CSI 300 Index since its October record. ‘Buy' calls still make up two-thirds of all recommendations for Chinese stocks, virtually unchanged from the market's peak, according to Bloomberg data.
“‘I just wouldn't buy,' Faber said in an interview from Bangkok July 4. ‘When a bubble bursts, you only hit bottom when people totally give up and vow they'll never buy stocks again. People are still more worried they'll miss the next rally.'
“China's rout has wiped out more than $2 trillion in market value after the government raised interest rates six times last year to cool the economy and commodities prices surged, fanning inflation. The CSI 300 more than doubled in 2006 and 2007, making its shares the world's priciest and prompting the government, Alan Greenspan, Warren Buffett, and Faber, to warn of a bubble.
“The last time Chinese stocks fell by half – from a June 2001 high – the Shanghai Composite Index took four years to reach its low. More than 60% of China's retail investors are ‘confident' about the performance of the nation's stock market in the next two years, the Shanghai Securities News reported, citing a survey it conducted with StockStar.com, a provider of financial data via the Web.
“The declines sent valuations for stocks on the CSI 300 Index to their lowest in more than two years last week, with the benchmark trading at 19.9 times reported earnings, a level last seen in April 2006.
“Faber, publisher of the Gloom, Boom & Doom Report, said Chinese shares could bounce off lows, though only temporarily. ‘We could have rebounds of 20% to 30%, but I wouldn't bet on it,' Faber said. ‘I would rather use rebounds as a selling opportunity.'
“‘Like the Nasdaq when the bubble burst in 2000, it rebounded but we're still 50% lower today than we were in 2000,' said Faber. ‘This is eight years later.'”
Source: Chua Kong Ho, Bloomberg , July 7, 2008.
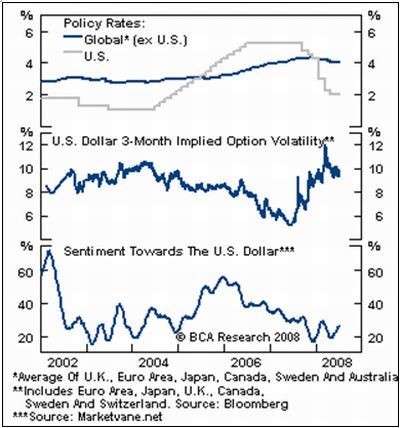
BCA Research: US dollar – next carry trade financing vehicle?
“The greenback is likely to become an appealing funding currency for global investors.
“In previous carry trade episodes, the funding assets showed similar characteristics. First, low interest rates keep the cost of carry down. Second, low implied option volatility provides a cushion against the risk of shorting the underlying asset. Third, investors became complacent towards the currency, believing that rallies should be sold into. The US dollar currently displays many of these characteristics. While volatility remains high, US policy rates are now lower than all other developed markets (aside from Japan), and it will prove difficult for the Fed to tighten in the face of bleak economic data.
“Combined with structural headwinds, investor sentiment towards the dollar is likely to remain depressed. Still, it will take global risk aversion to subside before the dollar or other currencies will be used meaningfully as a global financing vehicle. Bottom line: The US dollar is a prime candidate for carry trade financing in late 2008/early 2009.”
Source: BCA Research , July 9, 2008.
Financial Times: Commodity currencies coming under pressure
“Commodity currencies such as the Australian and New Zealand dollars are coming under pressure, despite weathering the early stages of the global slowdown and credit crunch extremely well, says Hans Redeker, global head of FX strategy at BNP Paribas.
“He notes that the Reserve Bank of Australia has acknowledged that the country's economy is feeling the negative effects of the global credit crunch and that a recent NZ Treasury report suggests that the New Zealand economy is already in a recession.
“‘Hence, we believe that the interest rate cycles in NZ and Australia have now peaked,' Mr Redeker says.
“But he also points out that it has been the international investment environment that has been the main driving force for the Australian and NZ dollars over the past few years, and that this is also deteriorating.
“‘Hopes of an emerging market decoupling have evaporated, with fears of stagflation now gripping the Asian regional markets,' Mr Redeker says. ‘Moreover, the fears of a global slowdown are also starting to have an impact on commodity prices – with the current exception of oil.
“There are clear signs that the major Australian dollar/US dollar uptrend is running out of steam. It is also interesting to note that there has been a sharp scaling back of speculative Australian dollar long positions from their recent peak over the course of the past few weeks, according to the CFTC position data.”
Source: Hans Redeker, BNP Paribas (via Financial Times ), July 9, 2008.
CNBC: Wilbur Ross on the rise in oil prices and other commodities
Source: CNBC , July 7, 2008
BCA Research: Crude prices – correction underway?
“Technical conditions paint a bearish picture for crude prices.
“Crude prices are up more than 100% over the past year and have become extremely overbought relative to most historical rate-of-change measures. In addition, market sentiment and open interest peaked some time ago (just as talk of $200/bbl oil became entrenched). Similarly, the recent decoupling of oil prices with both Treasury yields and energy stocks suggest that crude prices have overshot relative to the global economic backdrop. Moreover, policymakers are attacking speculators and any efforts by the G8 to orchestrate a firm dollar would be bearish for crude, although US fundamentals still argue for a soft greenback.
“The primary source of near-term support for oil prices is geopolitical and low inventory levels, albeit the Saudis have promised to increase output. Bottom line: We remain underweight crude oil within the commodity complex and expect prices to continue to grind lower in the coming months. This will be a critical development for risky assets to regain strength.”
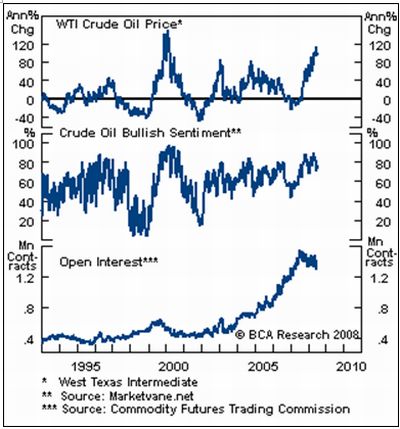
Source: BCA Research , July 9, 2008.
Ian Williams (Telegraph): Gold – the precious laggard that will hit $2,000
“This commodity super-cycle phenomenon shows no signs of abating. But to profit from it, investors need an understanding of the leads and lags within the commodity family to avoid being caught buying a particular commodity at a short-term peak in its price. I would be very wary about buying oil assets at present – simply because the price of oil in relationship to other raw materials is becoming very stretched.
“Gold is one of the biggest laggards and the one that confuses investors most. Like other commodities it made its super-cycle low in 1999 at $250 … Unlike oil, copper, nickel and a host of other commodities which have seen rises of between eight and thirteen fold increases in the last ten years, gold has risen a mere three and a half times from its low. This puts gold and gold mining shares very firmly in the laggard category.
“The sharp rise in oil and the relatively low rise in gold has pushed the gold/oil ratio to the lowest levels seen for decades. Either gold is incredibly cheap or oil is incredibly expensive on a relative basis.
“Even if oil were to succumb to short term profit-taking, very few commentators think that it would fall back much below $80 a barrel – a level still eight times its low in 1999. Gold hit a peak of $850 in 1980 and to equate that in real terms, i.e. adjusted for inflation, gold today would have to rise to around $2,500 an ounce at present. A rise of that magnitude would also restore the gold/oil ratio to its historic norm.
“A common reason offered for gold's relative underperformance is that it other commodities are driven solely by industrial demand whereas gold is subject to investor demand. This is only partially correct. Currently global jewellery demand of around 2,400 tonnes a year, roughly equates to global mine output so that this market is in balance.
“The swing factor that will affect the gold market is investor demand. Global investors can now buy exchange traded certificates (ETCs) and exchange traded funds (ETF) which alleviate the need to hold physical bullion in a bank vault. The demand from this source has to be set against supply from the central banks who have been consistent sellers over the last few years. The balance between these two holds the key to if and when gold will catch up with the other commodities.
“On a two- to three-year view the outlook looks increasingly bullish. Rising inflationary expectations around the world will lead to greater investor demand for inflation protected assets of which gold's 2000-year history in this space is unrivalled.
“Previously it was the sale of gold by central banks that supplied the market and helped keep a lid on the gold price. But this strategy is looking more and more like a busted flush. It is unlikely that the UK will be in a rush to sell any more of the Bank of England's gold, not that it has much left to sell. The same applies to many other central banks such as Holland, Belgium and Canada who have been long-term sellers of gold. They have run out of gold to sell. At the same time the central banks of the emergent economies, have become buyers.
“Recent evidence shows that the central banks of Russia and Argentina are buyers. It is also rumoured but not confirmed that the central bank of China and other sovereign wealth funds are also buyers. As these possible central bank buyers have trillions more cash than the Western central banks have gold, it is very easy to envisage a scenario where the central banks in aggregate turn into net buyers – even if certain western central banks continue to sell.
“And it is difficult to see where the extra supply would come from as mine output struggles to grow.
“The gold market would then suffer a severe price squeeze similar to that already seen in other raw materials. Investors who subscribe to this view should look to either buying gold direct (via ETFs or ETCs ) or to possibly make even more money in the gold mining sector.”
Source: Ian Williams, Telegraph , July 4, 2008.
Ifo: Eurozone economic slowdown confirmed
“Euro-zone real GDP expanded on a strong note in Q1 2008 after the disappointing performance in Q4 2007. However, the acceleration clearly overstated the underlying trend. Real GDP growth is forecast to slow down considerably in the coming quarters, expanding at rates of 0.0% in Q2 and 0.3% in both Q3 and Q4. Industrial production is loosing momentum, thereby reflecting the continuous downward tendency of business surveys due to worsening expectations. Private consumption is expected to grow by 0.2% in Q2 and 0.3% in both Q3 and Q4.
“Real disposable income growth is likely to remain weak as increases in nominal wages are eroded by high inflation rates. Investment is expected to expand on a modest path, with rates of -0.3% in Q2, a correction of the sharp increase in Q1, and 0.3% in both Q3 and Q4. On the assumption that oil prices stabilize at USD 135 per barrel of Brent and that the dollar/euro exchange rate fluctuates around 1.57 over the forecast horizon, inflation should peak at 4.0% in Q3, before easing gradually to 3.5% in Q4.”
Click here for the full report.
Source: Ifo , July 10, 2008.
Financial Times: Data raise fears of eurozone recession
“Steep falls in eurozone industrial production on Thursday highlighted the economic slowdown under way across the 15-country region, raising the risk of technical recessions in at least some member countries.
“France and Italy reported far sharper than expected drops in industrial output in May, echoing similarly weak German production and export data released this week and reinforcing expectations that second quarter eurozone growth figures would be bad.
“The change in mood has been sharpest in Germany, where the economy is thought to have contracted in the three months to June after an exceptional growth spurt at the start of the year.
“‘The tone of the debate in the eurozone might shift quite quickly from inflation concerns to straightforward growth concerns,' said Marco Annunziata at Unicredit, suggesting Germany faced an outside risk of recession – two consecutive quarters of negative growth. In Italy the risks were higher, Mr Annunziata said.
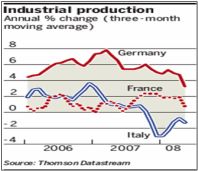
“France and Italy on Thursday reported falls of 2.6% and 1.4% in industrial output in May, suggesting that like Germany their manufacturing sectors had been hit by the impact of soaring oil prices on global growth prospects. Overall, eurozone industrial production figures – due to be released on Monday – could show a drop of 3%, the biggest monthly decline since June 1984, said James Ashley at Barclays Capital.”
Source: Ralph Atkins, Financial Times , July 10, 2008.
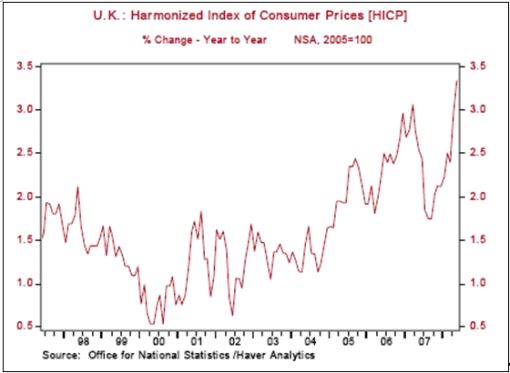
Victoria Marklew (Northern Trust): Bank of England – caught between conflicting risks
“As expected, the Bank of England's (BoE) Monetary Policy Committee (MPC) left the repo rate unchanged at 5.0% this morning, despite the fact that May's annual rate of inflation hit 3.3%. This was the highest since the BoE won full independence over monetary policy in 1997, and caused BoE Governor King to have to write an open letter to Chancellor Darling last month explaining why CPI is more than one full percentage point over the Bank's 2.0% target.
“But, as King pointed out, while inflation is likely to remain above target for some months yet, there is also a downside risk that the economy will slow sharply and pull CPI below target in two years. The past few days have certainly brought mounting evidence of a marked slowdown, with some analysts starting to whisper of the risk of recession.
“King continues to argue that the recent jump in CPI is the result of soaring global food and fuel prices, that the jump is likely to be temporary, and that there is little evidence so far of second round effects, particularly not of inflation pressures driving wages markedly higher.”
Source: Victoria Marklew, Northern Trust – Daily Global Commentary , June 10, 2008.
Financial Times: UK housing – falling over a cliff in slow motion
“What might happen to the British housing market? After a week of dire news from specialised mortgage lenders and housebuilders, this is an obvious question. It also plays directly into the darkest obsessions of the British, for whom nothing is more important than that houses become ever more ludicrously expensive.
“Certainly, houses became impressively costly between the middle of 1996 and the turn of this year. Over that period, real house prices rose by close to 190%, according to the Financial Times index. A trend fitted to a series on real house prices that goes back to January 1971 was 30% below the peak reached at the end of last year. In the third quarter of 2007, the ratio of average earnings to house prices peaked at just under six. This was almost double the ratio at the trough of 1995 and well above the previous peak of five reached in 1989.
“After the biggest house-price boom in the UK's history, can the country avoid the biggest ever bust? Fathom Consulting began a bulletin released this week by remarking sardonically that ‘as the UK housing market downturn gathers pace, it is common for analysts and commentators to argue that this downturn will not be as bad as the early 1990s … They are probably right. It looks [as though] it will be worse, perhaps far worse.' Fathom goes on to argue that nominal house prices are now falling considerably faster than in the late 1980s: the Halifax price index is down by 9.6% since August. This is almost as big a fall as the 13% decline in the early 1990s, when inflation contributed more to the decline in real prices.
“As the saying goes, if one laid all the world's economists in a row, they would still not reach a conclusion. In this case, too, economists differ on how far house prices have overshot justifiable levels. While it is possible to produce demographic and economic arguments for today's prices, it is hard to believe that they did not substantially overshoot sustainable levels. A 30% decline in real prices would hardly be surprising. It could well be considerably more.”
Source: Martin Wolf, Financial Times , July 10, 2008.
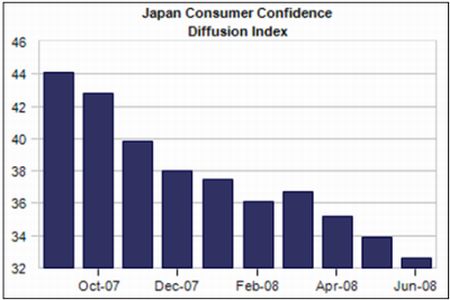
Moody's Economy.com: Japanese consumer confidence at all-time low
“Japanese consumer confidence fell to an all-time low in June. The index of household consumer confidence declined 1.3 points to 32.6.”
Source: Moody's Economy.com , July 11, 2008.
Bloomberg: Japan's wholesale inflation rises to a 27-year high
“Japan's wholesale inflation rate rose to a 27-year high in June as companies raised prices to counter record oil and commodity costs.
“Producer prices climbed 5.6% from a year earlier, after a revised 4.8% gain in May, the Bank of Japan said in Tokyo today. The median estimate of 36 economists surveyed by Bloomberg News was for 5.3%.
“Oil, wheat and soybean costs have almost doubled in the past year, forcing companies to charge more and fanning the fastest consumer-price inflation in a decade. Costs are gaining faster than firms can raise prices, prompting businesses to predict the first profit decline in seven years, a report last week showed.
“‘Producer prices are rising so rapidly that companies can't absorb them,' said Junko Nishioka, an economist at RBS Securities Japan in Tokyo. ‘Higher prices are squeezing profits to the point where companies have no choice but to pass costs onto consumers.'”
Source: Mayumi Otsuma, Bloomberg , July 10, 2008.
Bloomberg: South Africa heading for a recession, Moody's says
“South Africa may be heading for a recession by the end of the year as higher interest rates and surging inflation curb consumer spending, Moody's Investors Service said.
“A power shortage has also ‘cut into economic activity', while an increase in electricity prices is ‘further complicating monetary policy decisions,' Moody's said in an e-mail today.
“South Africa's Reserve Bank has increased its benchmark interest rate six times since June last year as it forecasts that inflation, currently at 10.9%, will exceed the 3% to 6% target range for the next two years. Africa's biggest economy expanded 2.1% in the first quarter, the slowest pace in more than six years.
“‘The housing and vehicle markets have slumped and both business and consumer confidence indicators now suggest that the economy could veer towards recession at the turn of the year,' Moody's said.
“Moody's put South Africa's Baa1 foreign currency rating on a positive outlook in June last year, prompted by an increase in foreign currency reserves, low foreign debt levels and a government budget surplus. Baa1 is the third-lowest investment grade and eight levels below the highest Aaa rating.
“Consumer confidence had its biggest drop in 24 years in the second quarter, increasing the likelihood of recession, First National Bank said on July 2. Higher interest rates have crimped spending on cars, with sales dropping an annual 22% in June, the 15th consecutive monthly decline, an industry body said on July 2.
“House-price growth slowed to an annual 3.8% last month, the slowest pace since September 1999, Absa Group, the country's biggest mortgage lender, said yesterday.”
Source: Nasreen Seria, Bloomberg , July 8, 2008.
By Dr Prieur du Plessis
Dr Prieur du Plessis is an investment professional with 25 years' experience in investment research and portfolio management.
More than 1200 of his articles on investment-related topics have been published in various regular newspaper, journal and Internet columns (including his blog, Investment Postcards from Cape Town : www.investmentpostcards.com ). He has also published a book, Financial Basics: Investment.
Prieur is chairman and principal shareholder of South African-based Plexus Asset Management , which he founded in 1995. The group conducts investment management, investment consulting, private equity and real estate activities in South Africa and other African countries.
Plexus is the South African partner of John Mauldin , Dallas-based author of the popular Thoughts from the Frontline newsletter, and also has an exclusive licensing agreement with California-based Research Affiliates for managing and distributing its enhanced Fundamental Index™ methodology in the Pan-African area.
Prieur is 53 years old and live with his wife, television producer and presenter Isabel Verwey, and two children in Cape Town , South Africa . His leisure activities include long-distance running, traveling, reading and motor-cycling.
Copyright © 2008 by Prieur du Plessis - All rights reserved.
Disclaimer: The above is a matter of opinion and is not intended as investment advice. Information and analysis above are derived from sources and utilizing methods believed reliable, but we cannot accept responsibility for any trading losses you may incur as a result of this analysis. Do your own due diligence.
Prieur du Plessis Archive |
© 2005-2022 http://www.MarketOracle.co.uk - The Market Oracle is a FREE Daily Financial Markets Analysis & Forecasting online publication.