


SP500 Stock Market Index Analysis
Stock-Markets / Stock Markets 2016 Mar 07, 2016 - 02:23 PM GMTBy: David_Petch

 Interesting charts to present today with the S&P 500 Index, which is probably a better market to follow to reflect global economy. As we are all aware, the US Dollar still remains the reserve currency of the US Dollar and with that privilege, it extends into the US stock market. As uncertainties build around the globe, money will look for a home...it may not be the prettiest home, but it is likely the securest.
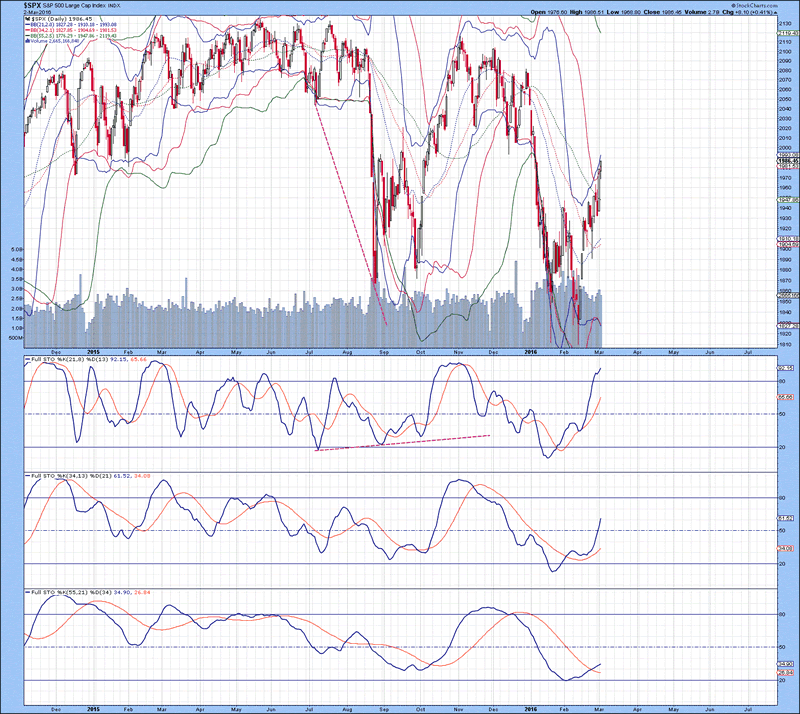
The daily chart of the S&P 500 Index is shown below, with the upper 21 MA Bollinger Band above the 34 MA Bollinger Band indicates an overbought condition has been generated. Lower 21 and 34 MA Bollinger Bands have curled down, indicating at least another two weeks of sideways to upward priced action before a top is put in place...when both curl up, a top will have been put in place, so this is a very useful metric to follow. There is resistance at 2000, but a move above this and the next major level of support lies between 2070 and 2100. Full stochastics 1, 2 and 3 are shown below in order of descent, with the %K above the %D in all three instances. Positioning of the %K in stochastics 2 and 3 also indicate at least another 2 weeks of upside before any sort of top is put in place.
Figure 1
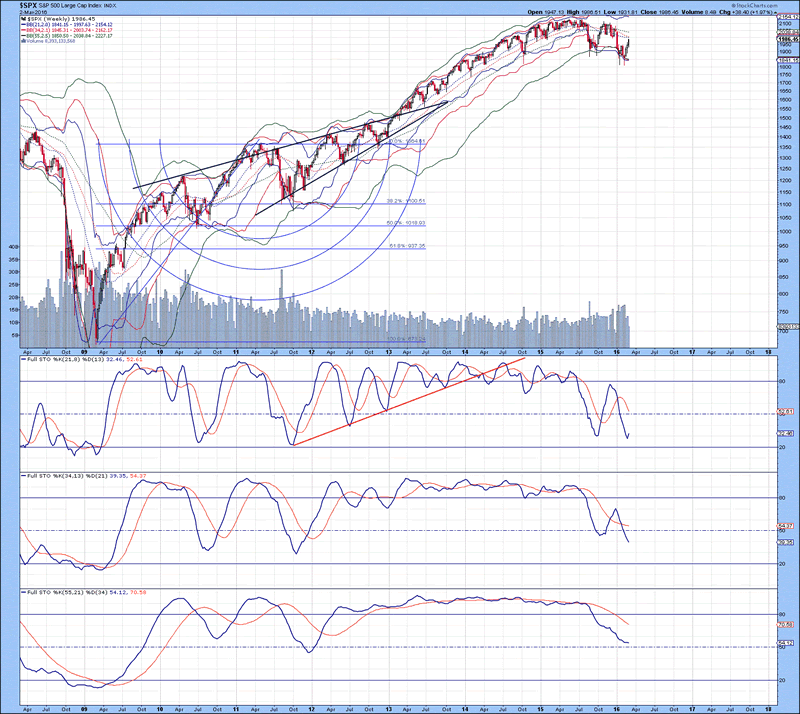
The weekly chart of the S&P 500 Index is shown below, with Bollinger Bands in their proper order of alignment indicates no overbought or oversold condition has been generated at this point in time. All three lower Bollinger Bands are in close proximity to each other, with stochastics near their low range indicates that the bottom likely has been put in place and upside strength is set to continue forward...if further declines were to occur, we should be seeing that right now but we are not. This observation is very important, as it suggests an accumulation of global funds into the US stock market. Full stochastics 1, 2 and 3 are shown below in order of descent, with the %K beneath the %D in all three instances. The %K in stochastic 1 has curled up, indicating the potential for further upside. With the current trend noted in the daily chart, the bullish upside bias is starting to show contagion in the weekly chart.
Figure 2
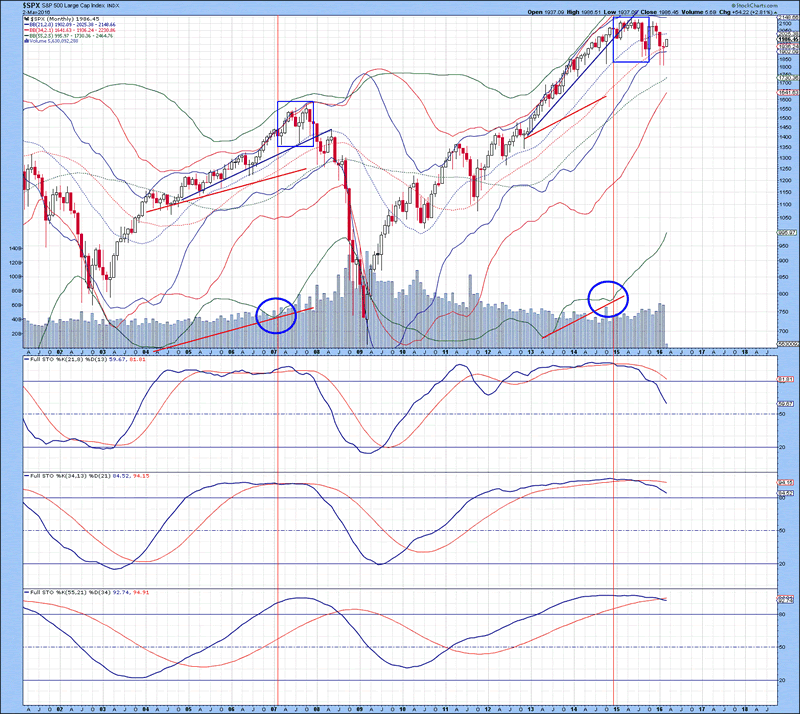
The monthly chart of the S&P 500 Index is shown below, with Bollinger Bands in their proper order of alignment indicates no overbought or oversold condition exists at this point in time. Blue boxes on the chart indicate inflection points of the lower 55 MA Bollinger Band, with the first one of 2007 indicating a prelude to the top that saw a 50% decline. This setup was in place in early 2015 which made an ominous setup for late 2015, but the potentially sharp decline did not happen. Full stochastics 1, 2 and 3 are shown below in order of descent, with the %K beneath the %D in all three instances. The %K in stochastic 1 has been beneath the %D for over 14 months, which historically has been associated with 30-50% declines. Since this has not happened, something else is going on here. With two long tailed doji's over the past two months (The last one being an impressive hammer doji), upside over the next few months could send the lower 55 MA Bollinger Band curling back down again, which would trigger a final push higher in the broad stock market indices. If the %K in stochastic 1 continues to decline for another 6-8 months, with the price staying within the current range, a 10% move lies ahead for the S&P 500 Index by year end. The pattern forming is starting to look more and more like a consolidation pattern than a sharp decline.
Figure 3
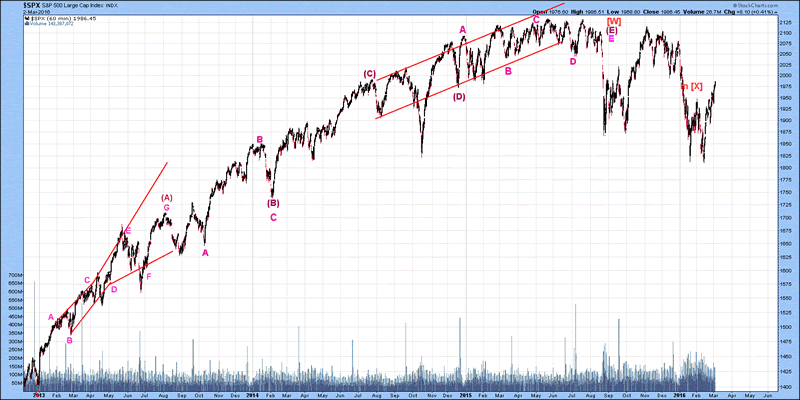
The mid-term Elliott Wave count of the S&P 500 Index is shown below, with wave [X] thought to still be forming. Minimally, wave [X] could be done, but it is unlikely given the momentum of the bounce off the recent lows. Wave [X] could persist into May or June before heading higher in wave [Y] to complete the longer-term pattern, denoted in Figure 6.
Figure 4
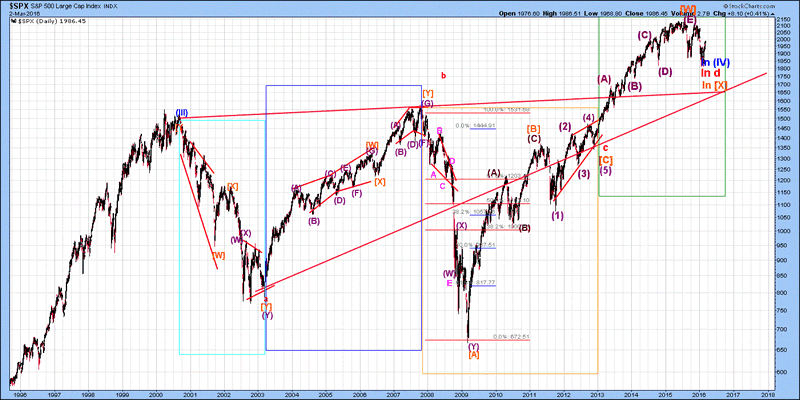
The long-term Elliott Wave count of the S&P 500 Index is shown below, with wave [X].d still forming. Once wave [X] completes, wave [Y] should continue to rise for at least 12-18 months before a top is put in place. The ultimate top for wave [Y].d is expected to be around 2350-2400 before declining in wave e. Wave e should last 2-3 years, which would represent the end of the bear market from 2000 until present. A 20 year bear market with a higher high would be the outcome, which fits with Glenn Neely's longer term Elliott Wave forecast for DOW 200,000 between 2060 and 2080. Focusing on the short-term, the S&P 500 Index is in a consolidation phase before heading higher into a longer-term top that should not be put in place until sometime between mid to late 2017. To negate this forecast, we would need to see two negative months with a downside move to 1650.
Figure 5
By David Petch
http://www.treasurechests.info
I generally try to write at least one editorial per week, although typically not as long as this one. At www.treasurechests.info , once per week (with updates if required), I track the Amex Gold BUGS Index, AMEX Oil Index, US Dollar Index, 10 Year US Treasury Index and the S&P 500 Index using various forms of technical analysis, including Elliott Wave. Captain Hook the site proprietor writes 2-3 articles per week on the “big picture” by tying in recent market action with numerous index ratios, money supply, COT positions etc. We also cover some 60 plus stocks in the precious metals, energy and base metals categories (with a focus on stocks around our provinces).
With the above being just one example of how we go about identifying value for investors, if this is the kind of analysis you are looking for we invite you to visit our site and discover more about how our service can further aid in achieving your financial goals. In this regard, whether it's top down macro-analysis designed to assist in opinion shaping and investment policy, or analysis on specific opportunities in the precious metals and energy sectors believed to possess exceptional value, like mindedly at Treasure Chests we in turn strive to provide the best value possible. So again, pay us a visit and discover why a small investment on your part could pay you handsome rewards in the not too distant future.
And of course if you have any questions, comments, or criticisms regarding the above, please feel free to drop us a line . We very much enjoy hearing from you on these items.
Disclaimer: The above is a matter of opinion and is not intended as investment advice. Information and analysis above are derived from sources and utilizing methods believed reliable, but we cannot accept responsibility for any trading losses you may incur as a result of this analysis. Comments within the text should not be construed as specific recommendations to buy or sell securities. Individuals should consult with their broker and personal financial advisors before engaging in any trading activities as we are not registered brokers or advisors. Certain statements included herein may constitute "forward-looking statements" with the meaning of certain securities legislative measures. Such forward-looking statements involve known and unknown risks, uncertainties and other factors that may cause the actual results, performance or achievements of the above mentioned companies, and / or industry results, to be materially different from any future results, performance or achievements expressed or implied by such forward-looking statements. Do your own due diligence.
Copyright © 2016 treasurechests.info Inc. All rights reserved.
Unless otherwise indicated, all materials on these pages are copyrighted by treasurechests.info Inc. No part of these pages, either text or image may be used for any purpose other than personal use. Therefore, reproduction, modification, storage in a retrieval system or retransmission, in any form or by any means, electronic, mechanical or otherwise, for reasons other than personal use, is strictly prohibited without prior written permission.
David Petch Archive |
© 2005-2022 http://www.MarketOracle.co.uk - The Market Oracle is a FREE Daily Financial Markets Analysis & Forecasting online publication.