


Gold GDX - What and where are the STRAITS of HELL,
Commodities / Gold and Silver Stocks 2016 Mar 07, 2016 - 09:33 AM GMTBy: Denali_Guide
 and why does anyone care, anyway ?
They are located and easily found btwn $HUI 280 and 300. Created by selling enough paper contracts to equal TWO (2) years of Newmont's production, in ONE DAY[1], THEY cleaned out all the bids from ceiling to floorboards, like a dust explosion. Clearly UN-Economic that was a signal from HELL that GOLD was doomed, from, in my opinion, THE POWERS THAT BE [ TPTB ]. We shall see.....
http://denaliguidesummit.blogspot.ca/search?q=straits+of+hell
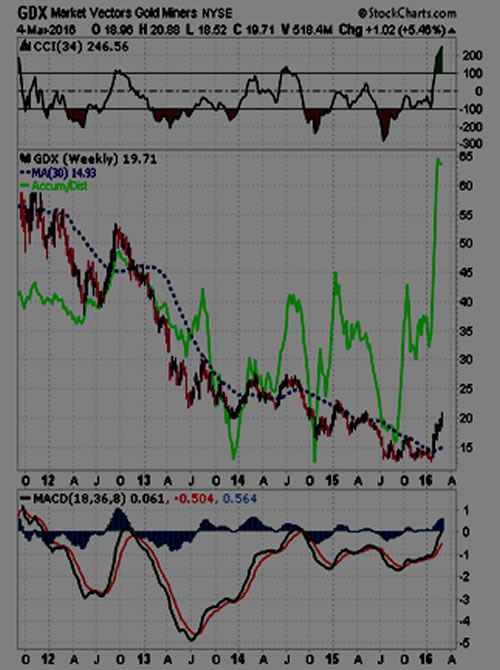
There is the link to bring you to several posts on my blog concerning the Straits of Hell and Whale Island. Why this ? Why now? Similar to the $HUI, the GDX Gapped down during the week of Apr 15, 2013. “Someone” decided that needed to be done and it was in resounding fashion, so much so that there is still an unclosed gap btwn HUI 280-300, and GDX 30-31. Why is this important ? We have been below that point for 34 weeks. Weekly charts are pretty strong, and we expect this to fill. It need not fill, it could be JUMPED. IF that were to happen, we would have one of the LARGEST ISLAND BOTTOMS in recent market annals and point to a possibly cataclysmic rise in Gold Miner Shares as the GDX & HUI. IF these averages just wade thru the Straits of Hell rather than jumping it, well that will be good, but not the same.
Lets address the WHY NOW? Point & Figure
charts as below are considered arcane or exotic depending on your vocabulary. I like to use them like a Builders BluePrint for a Work-in-Progress, that is,an architectural framework of sorts that points out likely limits of the current structure, and thus can change with other shifts in structure.

Here we see a potential trend neuter point of about 18.5 on the GDX, and an Upside potential of 34.5, far North of the location of The Straits of HELL. Be they a figment of my imagination or not, they represent to me a significant turning point.
“Once bitten, twice shy” describes what happens when a P & F target is missed. BUT “ Three (3) Times, a Charm” is also valid with this method. I will be watching it with great attention......to see.......Is this a real BULL MARKET ? Subscribe & Ck it out !!
By Denali Guide
http://denaliguidesummit.blogspot.ca
To the the charts involved, go here, to my Public Stock Charts Portfolio, and go to the last section. All charts update automatically. http://stockcharts.com/public/1398475/tenpp/1
© 2016 Copyright Denali Guide - All Rights Reserved
Disclaimer: The above is a matter of opinion provided for general information purposes only and is not intended as investment advice. Information and analysis above are derived from sources and utilising methods believed to be reliable, but we cannot accept responsibility for any losses you may incur as a result of this analysis. Individuals should consult with their personal financial advisors.
© 2005-2022 http://www.MarketOracle.co.uk - The Market Oracle is a FREE Daily Financial Markets Analysis & Forecasting online publication.