Stock Markets Dow, FTSE Tracking Crude Oil Rally Towards New All Time Highs 2016!
Stock-Markets / Stock Markets 2016 Mar 02, 2016 - 12:59 PM GMTBy: Nadeem_Walayat
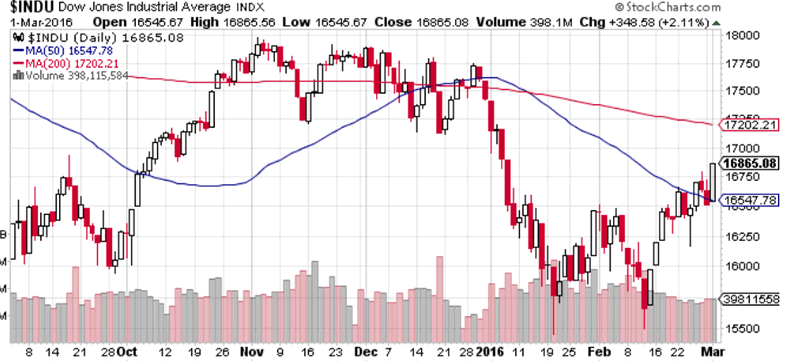
 The Dow's latest 350 point surge higher to 16,836 has put the stocks index within 4% of setting a new high for the year, so it's not looking like it's going well for the stocks bears who at least into early February were proclaiming that the Great Bear Market Apocalypse was upon us. Instead for the past couple of weeks or so have been increasingly going into hibernation. Though I have to give it to the perma bears, those who have been wrong for the longest are still out there pumping out bear market and crash rhetoric of 30%, 40% even more than a 50% drops!
For instance a quick google search resolves in the following recent headline from a prominent analyst. “The Dow is set to embark on a catastrophic plunge…all the way down to 6,000.” - Harry Dent - 29th Feb 2016
The problem is that the bears still don't understand what I voiced right at the very beginning of the stocks stealth bull market in March 2009 and several hundred times since that the markets are MANIPULATED, every stock price is manipulated, and they STILL don't get this fundamental fact and its consequences in terms of driving multi-year trends but instead bang on about this that or other for why the rally MUST end, just keep banging their heads against a brick wall.
15 Mar 2009 - Stealth Bull Market Follows Stocks Bear Market Bottom at Dow 6,470
The markets ARE manipulated, once you as a small investor come to agree with this statement then you can take the necessary steps to prevent yourself from being wiped out by ALWAYS keeping this in mind that Manipulated markets WANT you to act in a certain manner at certain times, they want you to buy into the latter stages of a bubble as the manipulators distribute, and the market manipulators want you to SELL into Market Bottoms and early bull rallies when the manipulators are accumulating.
Who are the market manipulators ? Today it is the Investment banks, investment funds, CEO's (stock options) and last but not least HEDGE FUNDS that created the stocks bubble through leverage of X20 or more that subsequently bankrupted the banks that were driven insane by short-term greed with trillions of dollars of liabilities which have NOW been fraudulently dumped onto the tax payers. I have not heard a single story of a hedge fund manager losing money, not one! They have BANKED their profits ! The losers are their investors who held on and the banks who leveraged them up to the tune of tens of trillions, and in the final instance the Tax payers who are being FORCED to bail out the bankrupt banks to the tunes of tens of trillions!
The only thing that actually matters is the PRICE ! NOTHING ELSE! and I mean NOTHING ! Not earnings, Not fundamentals. Listen to the PRICE or you WILL miss the Stealth Bull Market!
And remember this is what I have been stating for the SEVEN YEAR DURATION of this stocks bull market, so it is not something obvious with the benefit of hindsight as several recently are stating, all after the fact, after stocks have been rising for many years, that it was all due to Fed market manipulation but then add must imminently end! Doh! The Fed and the rest have been manipulating stock markets since at least October 1987! The day after the crash when the Dow BOUNCED! (See how I beat the 1987 CRASH).
Now whilst I have yet to get around to the usual thorough in-depth stock market analysis that tends to conclude in a near year long trend forecast for the primary reason that my attention for the past month or so has been diverted by Britain's very last chance to gain FREEDOM from the emerging EUSSR superstate that is the EU referendum, a campaign that currently has the LEAVE EU camp at a disadvantage both in terms of opinion poll standings (45 Leave to 55 Remain) and in terms of the establishment stacked against the BrExiters, which I will come back to towards the end of this article.
Nevertheless my series of interim stock market posts and videos have been unequivocally consistent in the following two points :
1. That the stock market was under going a severe correction that would resolve in a resumption of the stocks bull market.
2. That the stock market was expected to track the crude oil price trend forecast which called for an early Feb low at approx $25.
25 Jan 2016 - Stock Market Bottoming Out or the Last Bull Standing?
Stock Market Quick Technical Take
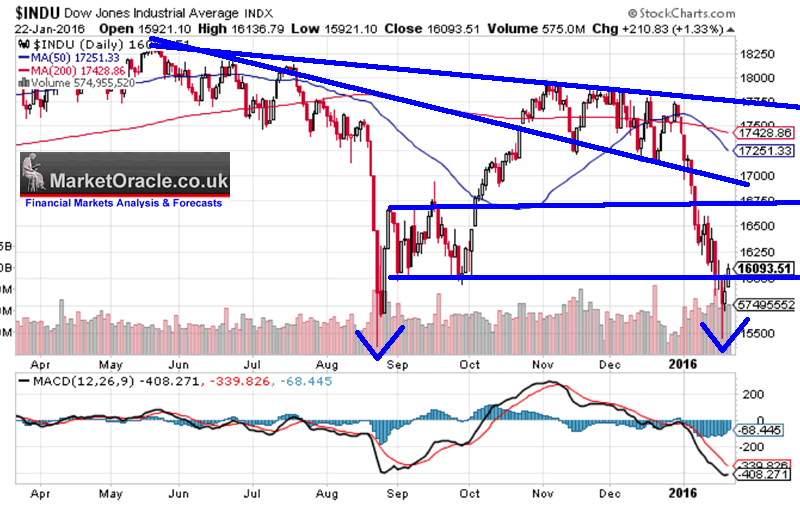
What jumps out form the stock chart is that the recent bounce was off the August low, can it hold ? We'll the decline into the low was pretty severe which technically means it's unlikely to hold which means that the stock market is in a larger corrective pattern that began of the May 2015 high, which is a pretty lengthy corrective pattern in terms of time i.e. from May to probably February, which has acted to unwind much bullish sentiment to the point where even many of the former bulls are now fully fledged bears, probably reaching their most vocal just as the stock market puts in its bottom.
MACD - Additionally the MACD is in the process of bottoming out from an extreme low which also confirms that further downside is very limited.
The bottom line is that the oil price trend and the stock markets oversold state are converging towards a stock market bottom that should carve out a final bottom for 2016 in a time window that probably runs for another 2-3 weeks. So whilst it is probably not going look pretty i.e. the last low of 15,500 looks likely to break, however given the oil price trend forecast then it should form the end of this stock market correction and herald the resumption of the stocks bull market.
Crude Oil Price Trend Forecast 2016
So once more the starting point for this 'interim' analysis of the stock market is where the crude oil price stands against the trend forecast for 2016. It is now 6 weeks since I published my forecast expectations for the crude oil price to bottom early February 2016 at approx $25, the actual bottom came in at $26 and within the time window for a final bear market bottom as excerpted below.
17 Jan 2016 - Crude Oil Price Crash Triggering Global Instability, Trend Forecast 2016
Crude Oil Price 2016 Forecast Conclusion
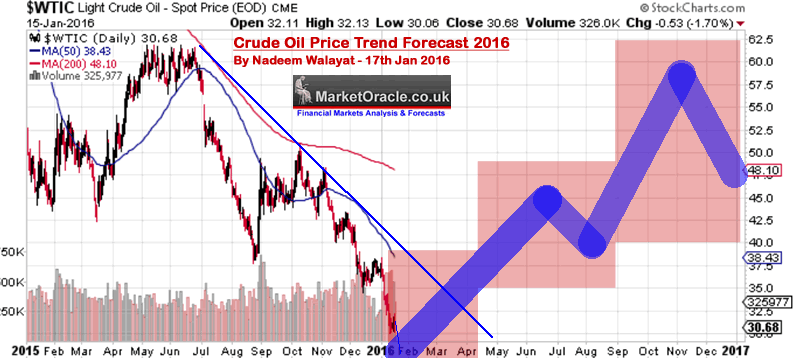
My forecast conclusion is for the crude oil price to trade within three distinct trading ranges for 2016 of $20 to $40, $35 to $50 and $62 to $40. Furthermore the trend pattern imposed onto the trading ranges implies that a bottom is likely by early February 2016 at around $25, followed by a trend higher into Mid year towards $50, a correction into September, followed by a trend towards $62 before succumbing to a correction during December to target an end year price of approx $48 as illustrated by the following forecast graph.
The bottom line is that the current the oil price collapse is a wake up call to all major oil producers that crude oil as an energy source is running out of time. So whilst there may be future oil price spikes, however the long-term trend, given the likes of climate change is for the oil age to go the way of previous ages such as the Stone Age and Bronze age and so it will be for the oil age. Which means nations such as Saudi Arabia, regardless of price understand they need to get as much of their oil out of the ground as possible and sold off before they run out of customers!
The crude oil price last close of $34 stands $8 higher than its recent multi-year bear market low of $26. Whilst little has changed fundamentally so far in terms of supply i.e. OPEC and others are still pumping flat out and Iran continues to ramp up production, nevertheless demand destruction of many smaller oil producers operating at below break even prices is finally starting to be discounted by the market.
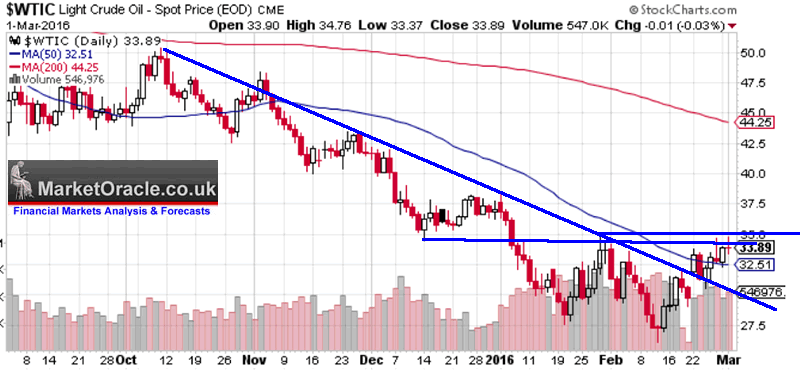
From a technical perspective the crude oil price has yet to make a significant higher high or bottom. Which probably means that the crude oil price is likely going to hug resistance along $34-$35 for some weeks before breaking higher. However, overall the crude oil price is showing little deviation from the trend forecast thus far so remains on track to target a DOUBLING off of its low price of $26 and therefore trend towards at least $52 before the end of this year.
Stock Market Quick Technical Take
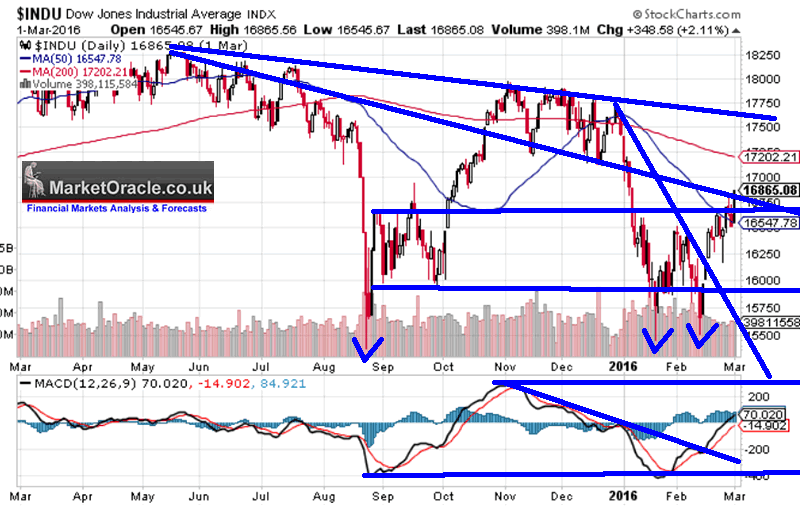
What jumps out form the chart is that the Dow has bounced thrice off of the August low, recently putting in a double bottom that has propelled stocks higher to the last close, a measuring move that's appears just about done and therefore targets a correction to probably between Dow 16,250 and Dow 16,000 as being the immediate term prospects for the Dow over the next week or so.
MACD - Has turned positive which overall favours a bullish trend higher.
Overall the impression is that the Dow having bottomed is now sowing the seeds for a sustained bull run that blasts the Dow through overhead resistance to over Dow 18k the timing of which is likely to follow a higher low off of an imminent correction.
Dow - Crude Oil Relative Trend
So what does crude oil say for the stock market going forward now that bottoms for both are in place?
Well prospects for a tough few weeks for crude oil are likely translate into a tough few weeks for stocks as well, so a week or so from now the Dow is likely to be lower than higher, but not by much as likely will be coming out of a correction, after which stocks should track the crude oil price rally higher .
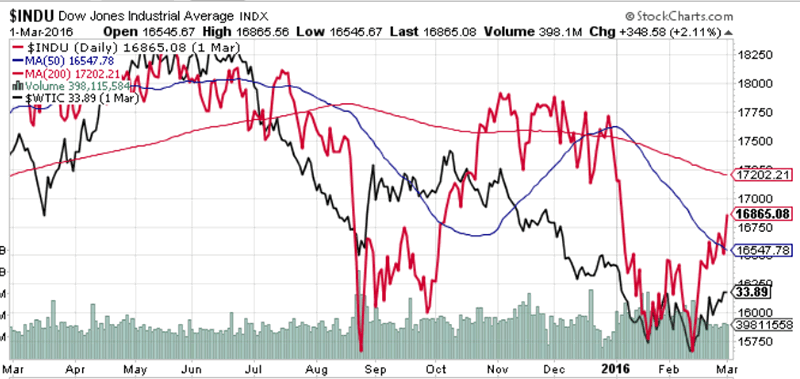
In terms of TREND, the above Dow and oil chart clearly demonstrates that the Dow tends to OUTPERFORM oil to the upside i.e. whilst the oil price has yet to breach it's last swing high, the Dow has already done so. Which given the prospects for oil price doubling from $26 to $56 then I cannot see why this should not translate into the Dow significantly breaching its all time trading high of 18,351. I'll cover exactly how high the Dow could go in a forth coming more in-depth analysis so ensure you remain subscribed to my always free newsletter.
The bottom line is that the perma-crowd will continue to see every dip as the start of a new bear market and thus be found banging their heads against the manipulated markets brick wall all the way to NEW DOW ALL TIME HIGH's!
FTSE Brief
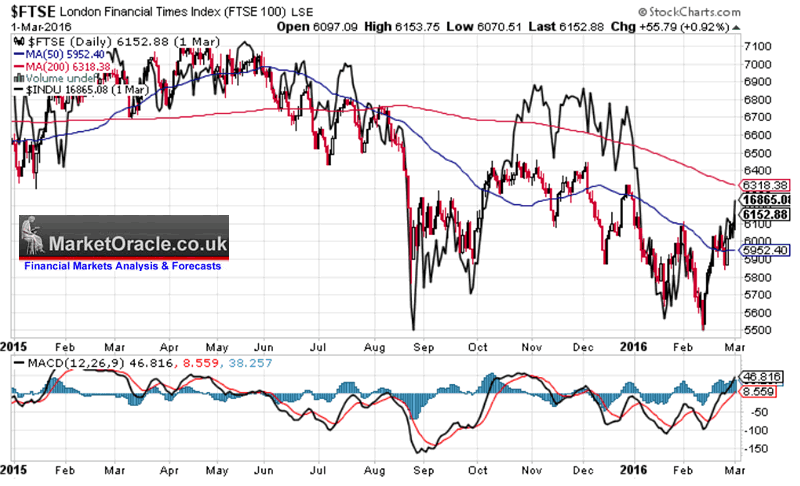
Despite the fact that the FTSE has just turned positive for the year and the Dow has yet to do so, usually the FTSE tends to marginally under perform compared against the Dow. However overall the Dow and FTSE do tend to trend pretty closely together and to date the FTSE is not showing any significant deviation despite all of the FEAR headlines in the mainstream establishment press of a litany of disasters that await an Independent and FREE UK that are just not being reflected by the stock market that is implying the opposite! Therefore, along with the Dow then the FTSE should ALSO target a NEW ALL TIME HIGH this year! Which I am sure the gullible mainstream press will report as being as a consequence of the EU referendum result.
EU Referendum
And where the EU Referendum is concerned then my opinion remains that this is Britain's VERY LAST chance to vote for FREEDOM from an emerging european superstate as the following two recent videos illustrate why-
And this video covers the key points of David Cameron's failures to negotiate anything of value that in large part amounted to nothing more than a smoke and mirrors exercise.
And lastly this is a reminder that Elliott Wave International have made their 50 page State of the Global Markets Report -- 2016 edition available to our readers for free for a limited period of time, so ensure you follow this link and claim your copy now.
And ensure you are subscribed to my always free newsletter (only requirement is an email address) for the following forthcoming analysis -
- US Interest Rates 2016
- US Dollar Trend Forecast
- Stock Market Trend Forecast 2016
- US House Prices Forecast 2016 and Beyond
- Gold and Silver Price Forecast 2016
Source and Comments: http://www.marketoracle.co.uk/Article54266.html
By Nadeem Walayat
Copyright © 2005-2016 Marketoracle.co.uk (Market Oracle Ltd). All rights reserved.
Nadeem Walayat has over 25 years experience of trading derivatives, portfolio management and analysing the financial markets, including one of few who both anticipated and Beat the 1987 Crash. Nadeem's forward looking analysis focuses on UK inflation, economy, interest rates and housing market. He is the author of five ebook's in the The Inflation Mega-Trend and Stocks Stealth Bull Market series that can be downloaded for Free.
 Nadeem is the Editor of The Market Oracle, a FREE Daily Financial Markets Analysis & Forecasting online publication that presents in-depth analysis from over 1000 experienced analysts on a range of views of the probable direction of the financial markets, thus enabling our readers to arrive at an informed opinion on future market direction. http://www.marketoracle.co.uk
Disclaimer: The above is a matter of opinion provided for general information purposes only and is not intended as investment advice. Information and analysis above are derived from sources and utilising methods believed to be reliable, but we cannot accept responsibility for any trading losses you may incur as a result of this analysis. Individuals should consult with their personal financial advisors before engaging in any trading activities.
Nadeem Walayat Archive |
© 2005-2022 http://www.MarketOracle.co.uk - The Market Oracle is a FREE Daily Financial Markets Analysis & Forecasting online publication.


