


Fascinating Gold Charts With Hidden Trendlines
Commodities / Gold and Silver 2016 Feb 19, 2016 - 03:24 AM GMTBy: InvestingHaven

 Gold had another very strong day, closing the day 2% higher. After a strong run over the last couple of weeks, the question is where gold stands, and how much upside potential it has. Let’s revise the charts and leading indicators in this article.
First, our daily gold chart (since gold peaked) shows that gold recently broke out of its downtrend. Interestingly, the gold price retraced this week to just below the resistance line, and closed today 1% above it. So far so good, this is strong price action without any doubt.
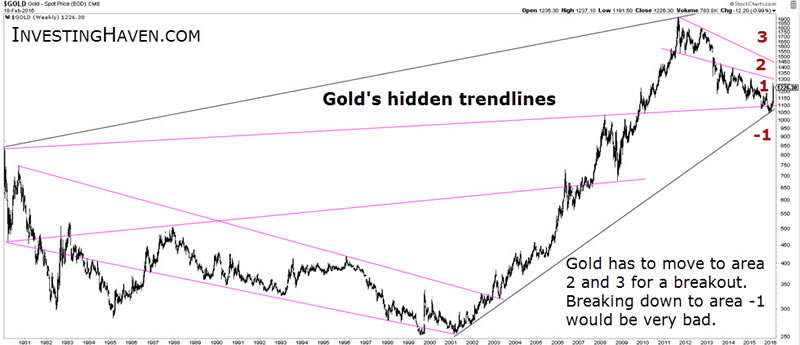
The more fascinating chart, however, is gold’s longer term chart. Our focus is on the hidden trendlines which have a predictive value. As readers know, hidden trendlines connect extreme swing highs and lows: the more extreme the swing, the more important its value. Gold’s hidden trendlines show four areas which we indicated with a red number.
We are currently in area 1, which is gold’s last chance. In other words, this is the area which has a last support line which could provide support for gold’s tactical correction in its secular bull market. Gold is currently moving very fast from support to resistance within area 1. In other words, nothing meaningful has changed with gold’s recent rally.
In order for a meaningful trend change to take place, gold has to move to area 2, and, ultimately, area 3 if it aims to continue its secular bull market. We are not there yet. Watch $1,300 and $1,450 as key price points: gold’s ability to sharply break those price levels, or inability to break that resistance, will tell us whether a real trend change will take place.
One of gold’s leading indicators is the market structure in the COMEX futures market. According to the latest data, we believe there is still some upside potential in the gold price. The rate of change of short positions of commercial traders has been rather high (not bullish) but their positions did not reach any sort of extreme level (quite bullish). So we consider a high probability of gold testing $1,300 rather soon.
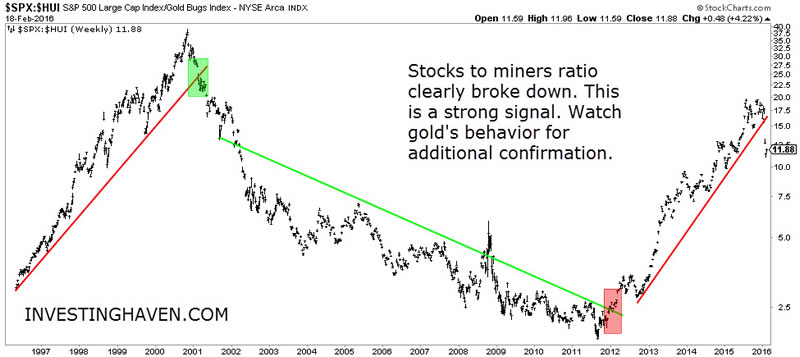
Gold miners, if anything, have shown a clear message: they are back. However, as the gold mining sector has been slaughtered, we see weakness in a lot of individual gold mining charts. There is still clear bifurcation within the gold mining segment. So investors should be very careful picking gold miners. As a leading indicator, however, they have been performing well enough, confirming strength in the gold market.
We are closely watching how gold miners and broad stock indexes behave as gold will test its critical $1,300 level.
CONCLUSION:
There is momentum in the gold market, and our chart with hidden trendlines shows the potential for gold to move to $1,300. That is confirmed by the leading indicators in the gold market, i.e. COMEX futures market structure and the gold mining segment.
However, gold’s recent strength is not yet the real deal. This rally is ‘for real’ once gold breaks above $1,300 (with conviction), and even more so above $1,450.
Analyst Team
The team has +15 years of experience in global markets. Their methodology is unique and effective, yet easy to understand; it is based on chart analysis combined with intermarket / fundamental / sentiment analysis. The work of the team appeared on major financial outlets like FinancialSense, SeekingAlpha, MarketWatch, ...
Copyright © 2016 Investing Haven - All Rights Reserved Disclaimer: The above is a matter of opinion provided for general information purposes only and is not intended as investment advice. Information and analysis above are derived from sources and utilising methods believed to be reliable, but we cannot accept responsibility for any losses you may incur as a result of this analysis. Individuals should consult with their personal financial advisors.
© 2005-2022 http://www.MarketOracle.co.uk - The Market Oracle is a FREE Daily Financial Markets Analysis & Forecasting online publication.