


Is Stock Market Phase Low in Place?
Stock-Markets / Stock Markets 2016 Feb 15, 2016 - 12:07 PM GMTBy: Andre_Gratian

 Current Position of the Market
SPX: Long-term trend - Severe correction underway.
SPX: Intermediate trend - Possible phase low. Needs confirmation.
Analysis of the short-term trend is done on a daily basis with the help of hourly charts. It is an important adjunct to the analysis of daily and weekly charts which discuss longer market trends.
IS A PHASE LOW IN PLACE?
Market Overview
On Thursday, a decline which started at 1947 on the SPX broke the January 20 low of 1812 by a couple of points, and immediately reversed to finish on Friday's close at 1864, with a 52-point bounce. Because of this being a potential double bottom, some analysts were quick to call this a bottom for the downtrend which started at 2116? Is it?
Maybe yes and maybe no! It all depends on whether the next few days confirm it. What would it take for a confirmation? Either to keep going and surpass 1882 after a minor pull-back, or to spend some time consolidating above 1812 and then resume the rally. The two currently carry about equal weight -- if we have made the low, that is! Let's consider the market position in detail so that we can be prepared for what comes next.
The case for additional upward progress is fairly good because the congestion pattern which has formed above 1810 is capable of higher counts, but probably not before a pull-back because a valid target to 1864 (1868?) -- which is where the SPX closed on Friday -- has already been reached. The next one could take us to about 1900. Beyond that, it becomes iffy and will depend on how the uptrend develops.
A case can also be made for a new low before a good counter-trend rally begins, for the following reasons: Cycles should still be down until later in the month; there are valid projections to lower levels; the minimum downside target for the H&S pattern has not yet been reached! Not one of these is absolute, so it is possible that they will be completely ignored by the market if it has its mind set on staying with the double bottom formation. We just need to allow the next week or two to clarify if an intermediate low is already in place.
SPX Chart Analysis
Daily chart (This chart, and others below, are courtesy of QCharts.com)
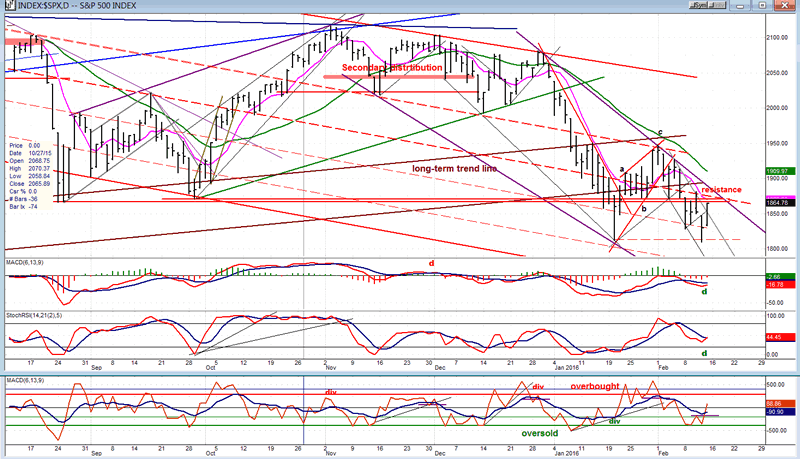
I have already mentioned that the index has reached its most logical price target from Thursday's low.
There are two immediate obstructions to its going higher: the strong overhead resistance created by last year's 1868-1872 lows which is reinforced by the multiple short-term lows occurring last December at the 1972 level, as well as the pink 8-DMA which is currently just below 1870, whose effect on prices is better observed on a closes-only chart.
On the chart, we can see that for a reversal to be confirmed, we would also have to break above the trend line from the 2082 level which is the principal trend line of this downtrend phase. On Tuesday, it would meet with prices at about 1882. A little higher, the index would also meet with the green 30-DMA which currently trades at 1910. In other words, it would take more concerted buying to push above all these overhead obstacles and confirm that an important reversal has taken place. As mentioned above, prices do not normally extend beyond such strong resistance without adequate preparation which can best be observed on the P&F chart as a pattern of accumulation which has enough of a count to suggest the rally has the potential for much higher prices. As things now stand, even if the resistance is overcome, the rally would fail to reach beyond the 1947 top unless additional accumulation is created.
If we look at the indicators, it is true that we can now plainly see that positive divergence (bullish) has formed in the momentum indicators, and the A/D oscillator has already potentially given a buy signal, which is also bullish. This probably suggests that some sort of a low has been made. But the momentum indicators have not yet made a bullish cross and this could still be delayed by a few days, especially in the MACD.
Hourly chart
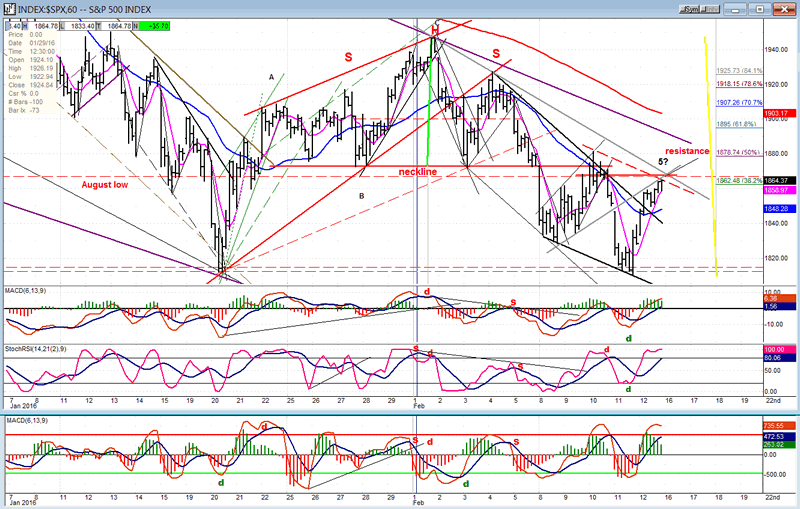
On the hourly chart, in addition to the resistance items mentioned above, we can add a few more: the dashed red parallel to the trend line connecting the last two short-term lows; the extension of the grey trend line which connects the two bottoms of the last short-term low; the thin downtrend line which connects the first two tops of the decline from 1947; higher, the red 200-hr MA; and finally, the probability that the bounce from the low will stop at the .382 retracement of the total decline from 1947 to 1810 which is where prices ended up on Friday. If they do not, the .50 retracement is a good bet, while .618 would match the higher count from the current base.
Something that argues against moving above the resistance band right away, is the position of the indicators which have begun to roll over, including the A/D oscillator which is overbought and is turning down in spite of a very positive close in the A/D differential.
One final factor (upon which I will later elaborate) is that, what the market does may still be subservient to the price action of oil over the next few days.
TRAN (Dow Jones Transportation average)
XBD hardly acknowledged the rally but, in spite of its reputation as a market leader, XBD may have been more of a market follower in this bull/bear cycle. Therefore, its lack of full participation in the rally is not conclusive. To its credit, it did precede the initial SPX decline by a few days. And we need to acknowledge that it made a substantially lower high compared to its 2007 high while the principal averages went on to experience nose bleeds!
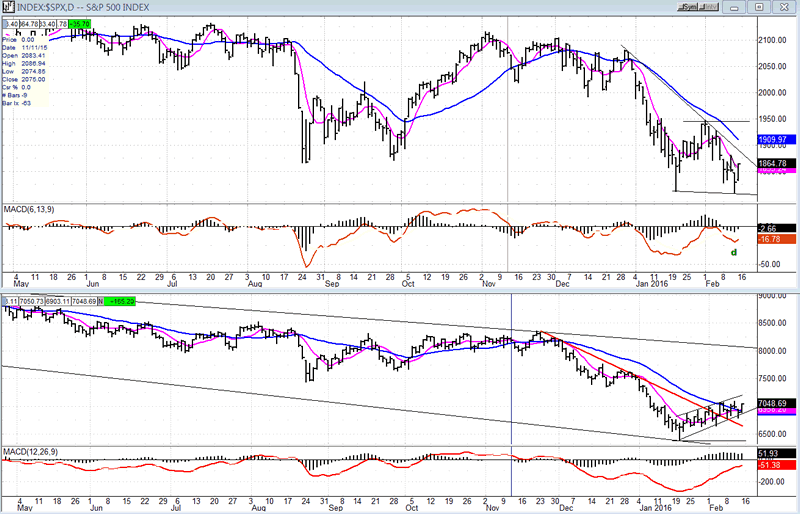
On the other hand, the TRAN started to show relative weakness about five months before SPX began its August decline. I have posted a chart of the SPX (top) and TRAN (bottom) so that we may compare their relative actions over the past few months. Of any leading index, TRAN issued the clearest indication that a market decline was coming. This is why its action of the past three weeks should be considered a warning that a market rally may be in the offing. Of course, the warning time is far shorter than it was at the market top. From this, we may deduce that the rally in a downtrend may only be a blip and not a lasting affair, providing the TRAN soon shows signs of wanting to continue on its downward course. Its action for the next week or so could be important.
UUP (dollar ETF)
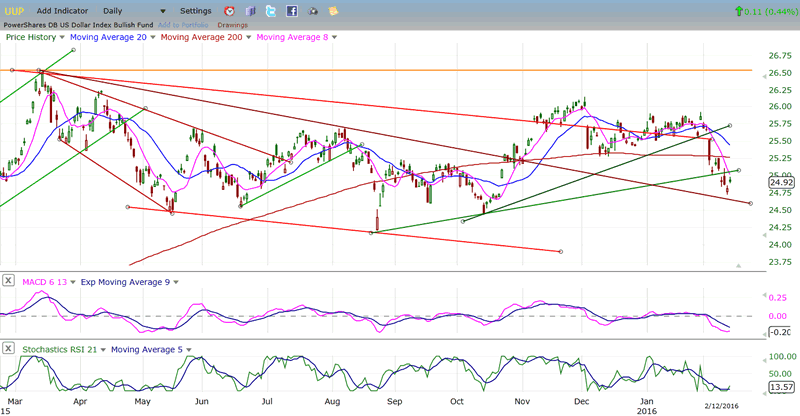
UUP continues to correct, but remains in the top range of the consolidation pattern which started last March. Although it has broken below its 200-DMA, it is too soon to say that it has started a significant downtrend. It has now breached two short-term uptrend lines, but it is nearing the extension of an important downtrend line where it could find at least temporary support. As long as it does not fall below the bottom of its consolidation range, it remains in a corrective pattern after its sharp rise from the June 2014 low.
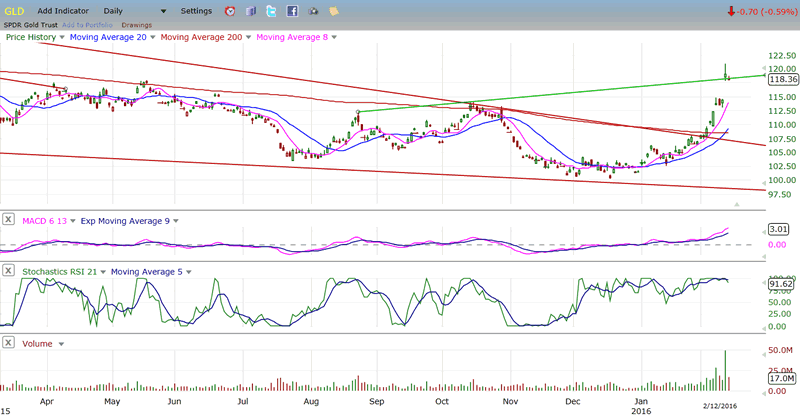
GLD (Gold trust)
GLD's last low point within the long-term declining wedge turned out to be a saucer-shaped bottom which, typically, results in a parabolic move and, in GLD's case, could have ended with a buying climax after a wide exhaustion gap caused by massive short-covering when it broke above its last short-term top. If this is correct, a quick retracement of six points to fill the gap may take place at any time.
However, by moving above 113, GLD has significantly extended its count which is now higher. So, even if it chooses to quickly fill its gap, it would probably only be a minor correction to the former short-term top which has now become an important support level.
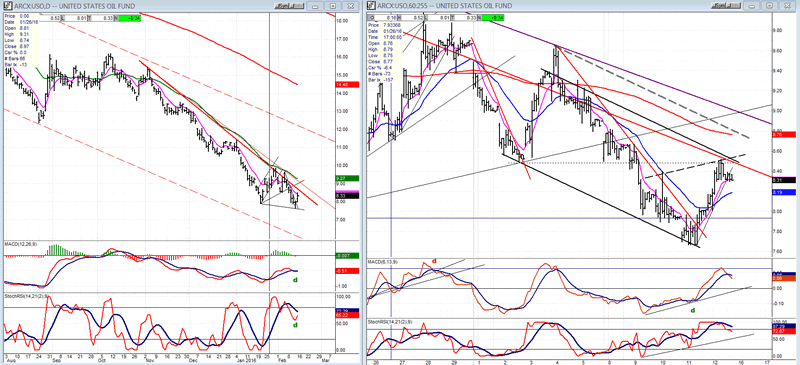
USO (United States Oil Fund)
After reaching its projection, USO had a strong bounce then sold off again to a new low. It's second bounce, last week may have been a factor in SPX holding at its former low. On the charts below, you can see that the initial rally failed at the downtrend line, although it did breach it before retracing. On Friday, USO reached that trend line again and started to back off. You can see this better on the 60m chart on the right. It's only a matter of time before it breaks it decisively. This should start the beginning of a narrow range basing pattern which could last for some time, unless some geopolitical event affects the current oil production balance.
The current question is what kind of push back can we expect from the trend line resistance. While the formation looks like the completion of a 4th wave and a potential start of the 5th, we cannot classify this as an impulse wave because on Friday, the rally overlapped wave 1 by a fraction. That violates the EWT concerning impulse waves. That aside, it would not prevent oil from retracing to a new low before beginning to form its base. Since the price of oil is still affecting the market, another new low in oil could help SPX to reach its lower projections. On the other hand, if USO extends its rally outside the trend line, it will help SPX to push beyond the resistance level described above. This is another index to watch closely over the next week!
Summary
On Friday, SPX acted as if it had made a double bottom at the 1810/1812 level. The rally which ensued after the reversal extended beyond a simple bounce, although the daily volume was not all that impressive. As explained in detail above, by the close the index had reached a strong resistance level as well as a minor phase projection and may start to retrace right away. I also mentioned that cycles are not favorable to an extended rally at this time, and that there are unfilled lower projections. We will therefore have to watch if there is some substantial upside follow-through that would confirm that a significant uptrend may have started on Friday.
Andre
FREE TRIAL SUBSCRIPTION
If precision in market timing for all time framesis something that you find important, you should
Consider taking a trial subscription to my service. It is free, and you will have four weeks to evaluate its worth. It embodies many years of research with the eventual goal of understanding as perfectly as possible how the market functions. I believe that I have achieved this goal.
For a FREE 4-week trial, Send an email to: info@marketurningpoints.com
For further subscription options, payment plans, and for important general information, I encourage
you to visit my website at www.marketurningpoints.com. It contains summaries of my background, my
investment and trading strategies, and my unique method of intra-day communication with
subscribers. I have also started an archive of former newsletters so that you can not only evaluate past performance, but also be aware of the increasing accuracy of forecasts.
Disclaimer - The above comments about the financial markets are based purely on what I consider to be sound technical analysis principles uncompromised by fundamental considerations. They represent my own opinion and are not meant to be construed as trading or investment advice, but are offered as an analytical point of view which might be of interest to those who follow stock market cycles and technical analysis.
Andre Gratian Archive |
© 2005-2022 http://www.MarketOracle.co.uk - The Market Oracle is a FREE Daily Financial Markets Analysis & Forecasting online publication.