


Financial Meltdown 2008-style in 2016?
Stock-Markets / Financial Crisis 2016 Feb 14, 2016 - 04:43 PM GMTBy: Clif_Droke

 As the global market crisis continues, the danger posed by this crisis to the U.S. economy continues to be underestimated by economists and central bankers. A report recently showed that U.S. job openings surged in December and the number of American voluntarily quitting work hit a nine-year high. According to the report, this data points to “labor market strength despite a slowdown in economic growth.”
Further commenting on the supposedly improving labor market, Reuters stated: “The signs of a robust jobs market could ease concerns about the health of the economy, which were underscored by other reports on Feb. 9 showing a drop in small business confidence in January to a two-year low and further declines in wholesale inventories.”
It was also noted that economists at the Federal Reserve look at these numbers to determine their monetary policy. What this translates to is that the Fed now has another incentive to continue pursuing their tightening policy. This is exactly the opposite of what the market needs. Indeed, the direction of Treasury yields (below) is screaming to the Fed that looser money is what it desperately wants.
Reuters quoted Joel Naroff, chief economist at Naroff Economic Advisors, as saying: “If the labor market is tightening, can the economy really be faltering?” Allow me to answer his question with an emphatic “yes!”
Most economists continually underestimate the degree to which the stock market acts as an extension of money supply. That’s why the saying, “As goes the stock market, so goes the economy,” is so true. The global bear market in equities has already led to trillions of dollars in losses, and this will sooner or later show up in the U.S. economic numbers. Unfortunately, by the time it does it may be too late for the Fed to take effective action to forestall recession.
One would think by now that Fed Chair Yellen would have learned a lesson. Yet the overall tenor of her recent comments suggests that she is completely oblivious to the negative effects that higher interest rates are having on equities. The fact that one FOMC voting member recently implied that the Fed would likely raise rates four times this year testifies to how oblivious the central bank is to the growing threat of a U.S. economic slowdown.
Taking the sum of the various comments from FOMC members, it would appear there is confusion within the Fed. There is no clear consensus from voting members on what tact the bank should take in the coming year in regard to interest rate policy. A market-sensitive central banker like Ben Bernanke would know what to do. He would heed the market’s cry for liquidity, liquidity, and more liquidity.
By contrast, Yellen appears to be frozen in the oncoming headlights of the global crisis. This is not what the market wants to see. In times of crisis the market wants above all to have confidence in its policy makers. Until it receives a calming message from the Fed, the uncertainty will likely continue. And as veteran market analyst James Dines used to say, “bear markets are characterized by the high state of uncertainty.”
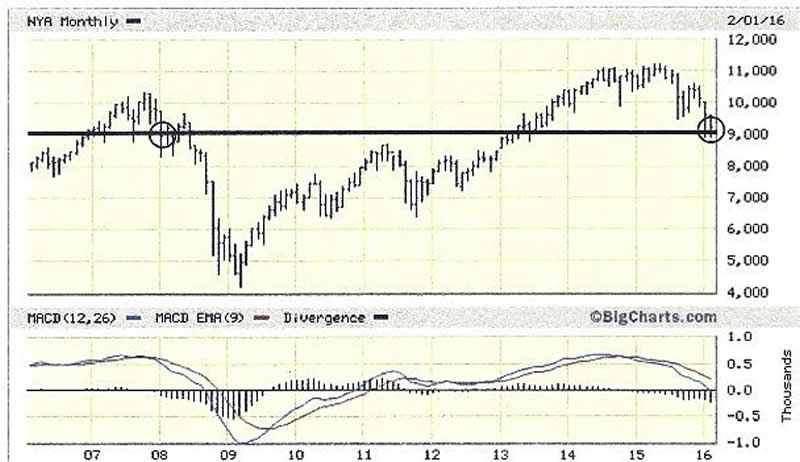
Meanwhile stock analysts and economists are debating whether or not the global economic crisis is sufficiently big enough to cause another 2008-style crash. The crisis hasn’t metastasized enough to allow for a definitive answer yet, but here is a technical point worth considering: The following graph shows the NYSE Composite Index (NYA) going back over the last 10 years. I think it’s noteworthy that the NYA is testing the 9,000 level which can be viewed as a technical/psychological benchmark with origins in the 2007-2008 credit crisis. Note that when the NYA first broke below the 9,000 level in January 2008 (circled), it served notice that crisis conditions were fully underway. It was eventually followed by a waterfall decline in the major averages.
The significance of the 9,000 level in the NYA was further underscored in early 2013 when the runaway phase of the QE-fueled bull market kicked off. The NYA hesitated for a few weeks after initially breaking above the 9,000 level in 2013, but after re-establishing support above this level it was off to the races and the market barely looked back from there until finally hitting the wall in late 2014.
History doesn’t normally repeat by the letter, so if the NYA breaks under 9,000 this time it won’t necessarily be followed by a similar cascade-style crash. However, a break under the 9,000 would definitely be of concern and would indicate abnormal weakness. It could also invite panic selling, which knows no bounds if it occurs within the context of a major financial or economic crisis. I normally don’t put great emphasis on chart levels, but in this case I believe we should closely monitor the 9,000 level in the NYA. The bulls will likely do everything in their power (limited though it may be right now) to protect the 9,000 level from being violated in the near term.
The market rarely moves in a straight line, though, and that’s one reason why navigating a bear market is very challenging. Bear market rallies tend to occur after major support levels have been tested, and the primary function of those rallies is to keep investors from selling. They also tend to mask the presence of the bear and keep investors in a state of confusion, hence the reason why extremes in pessimism normally don’t occur until after the bear has run its course.
Mastering Moving Averages
The moving average is one of the most versatile of all trading tools and should be a part of every investor's arsenal. Far more than a simple trend line, it's also a dynamic momentum indicator as well as a means of identifying support and resistance across variable time frames. It can also be used in place of an overbought/oversold oscillator when used in relationship to the price of the stock or ETF you're trading in.
In my latest book, Mastering Moving Averages, I remove the mystique behind stock and ETF trading and reveal a simple and reliable system that allows retail traders to profit from both up and down moves in the market. The trading techniques discussed in the book have been carefully calibrated to match today's fast-moving and sometimes volatile market environment. If you're interested in moving average trading techniques, you'll want to read this book.
Order today and receive an autographed copy along with a copy of the book, The Best Strategies for Momentum Traders. Your order also includes a FREE 1-month trial subscription to the Momentum Strategies Report newsletter: http://www.clifdroke.com/books/masteringma.html
By Clif Droke
www.clifdroke.com
Clif Droke is the editor of the daily Gold & Silver Stock Report. Published daily since 2002, the report provides forecasts and analysis of the leading gold, silver, uranium and energy stocks from a short-term technical standpoint. He is also the author of numerous books, including 'How to Read Chart Patterns for Greater Profits.' For more information visit www.clifdroke.com
Clif Droke Archive |
© 2005-2022 http://www.MarketOracle.co.uk - The Market Oracle is a FREE Daily Financial Markets Analysis & Forecasting online publication.