


France CAC40 Stock Market Technical Outlook
Stock-Markets / European Stock Markets Feb 13, 2016 - 06:25 PM GMTBy: Austin_Galt

 The French stock index, the CAC40, has traded more or less as outlined in analysis produced back in May 2015. That analysis called the top in place and outlined expectations of a bear market to play out.
Price hit a low this past week at 3892 which was just over 26% down from the May 2015 high and I believe that may well represent the final low to the bear market.
Let's take a top down approach to the analysis beginning with the monthly chart.
CAC40 Monthly Chart
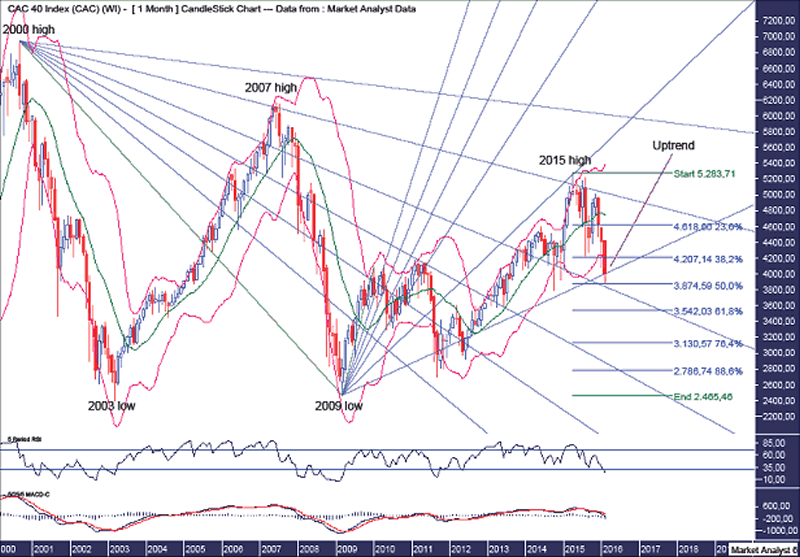
I showed this chart back in May 2015 using the same bullish and bearish Fibonacci Fans to identify the 2015 high so let's revise them.
The bullish fan drawn from the 2009 low shows the 2015 high bang on resistance from the 76.4% angle while price is now back at support from the 88.6% angle.
The bearish fan, drawn from the 2000 high, shows the 2015 high at resistance from the 76.4% angle while price is now just above support from the 61.8% angle.
I have added Fibonacci retracement levels of the move up from 2009 low to 2015 high and the recent low was right around support from the 50% angle which keeps the uptrend in a relatively strong position, assuming this is the low of course.
The Bollinger Bands show the 2015 high traded above the upper band while the current low has traded well below the lower band. This characteristic is a common feature found at solid highs and lows.
The RSI is oversold while the MACD indicator is still bearish so caution still needs to be heeded but I believe conditions on the monthly chart are certainly conducive to a resumption of the uptrend.
CAC40 Weekly Chart
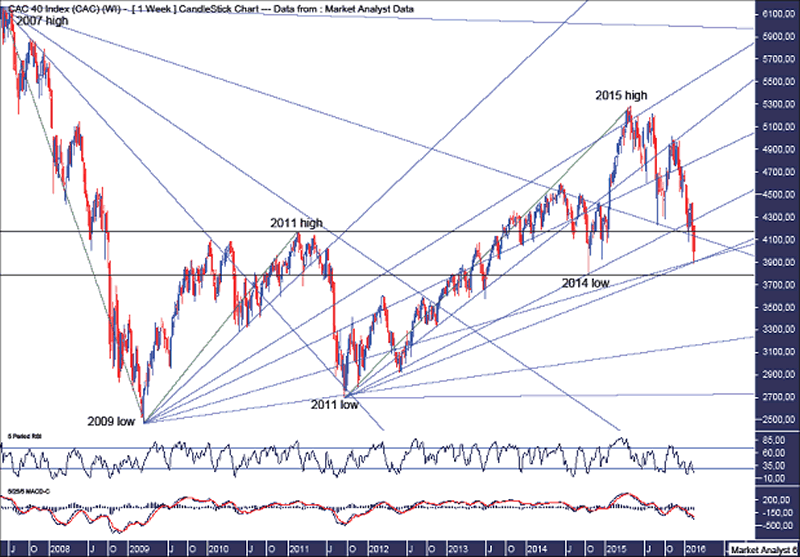
The upper horizontal line denotes the 2011 high of 4169 and price has dipped under this level as it gives that support a thorough test.
The lower horizontal line denotes the 2014 low of 3789 and price turning back up above this level effectively puts in the next higher low thereby keeping the overall uptrend intact.
I have drawn three Fibonacci Fans but have excluded some unimportant angles to keep the picture uncluttered. Let's run through them.
The bearish fan drawn from the 2007 high shows the 2011 low at support from the 61.8% angle. The 88.6% angle provided solid resistance all throughout 2014. Once price eventually cracked above this 88.6% angle it became support and price has just dipped back under this angle as it gives the support a good test. I expect a bounce back above the angle imminently.
The bullish fan drawn from the 2009 low shows the 2015 high at resistance from the 50% angle. The 2011 low was bang on support from the 88.6% angle while the current low is bang on support from the 61.8% angle.
The bullish fan drawn from the 2011 low shows the 2014 low bang on support from the 50% angle while the current low is bang on support from the 61.8% angle.
So, there is clearly some excellent symmetry going on and it adds confidence that we may well have a solid low in play here.
The RSI is oversold with a bullish divergence showing at this price low while the MACD indicator is bearish although price turning back up would see that change fairly quickly.
Let's wrap it up with the daily chart.
CAC40 Daily Chart
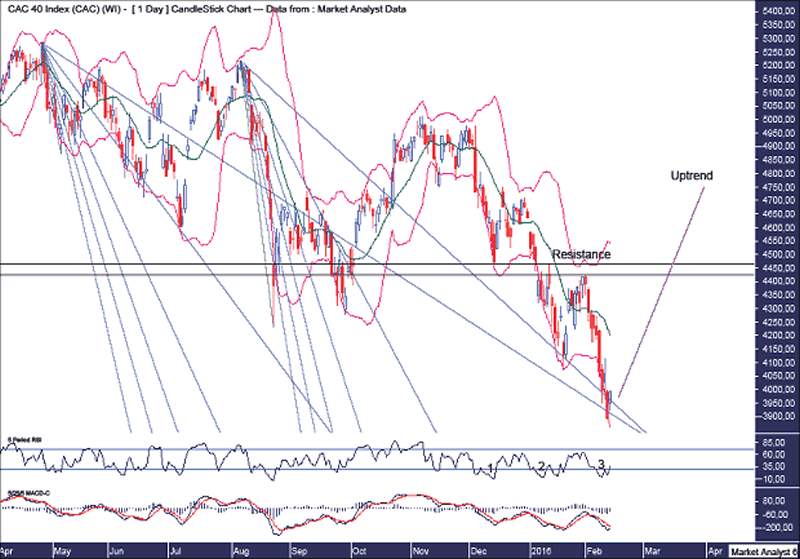
I have drawn two bearish Fibonacci Fans - one from the 2015 high and one from the major secondary high. Both show the current low being right around support from the 88.6% angles from both fans. Nice.
The Bollinger Bands show price threatening to leave the lower band but until that happens it is still possible to push a touch lower or at least test the low.
The RSI shows a triple bullish divergence in place which often leads to a significant price rise while the MACD indicator is bearish although the averages do appear to be coming together with the potential for a bullish crossover shortly.
The two horizontal lines denote resistance from previous swing highs and price needs to bust above here to confirm the low is indeed in place.
Summing up, I have been bearish since my previous analysis called the bull market high back in 2015. I am now changing the outlook back to bullish with the expectation that a new bull market is about to begin.
By Austin Galt
Austin Galt is The Voodoo Analyst. I have studied charts for over 20 years and am currently a private trader. Several years ago I worked as a licensed advisor with a well known Australian stock broker. While there was an abundance of fundamental analysts, there seemed to be a dearth of technical analysts. My aim here is to provide my view of technical analysis that is both intriguing and misunderstood by many. I like to refer to it as the black magic of stock market analysis.
Email - info@thevoodooanalyst.com
© 2016 Copyright The Voodoo Analyst - All Rights Reserved
Disclaimer: The above is a matter of opinion provided for general information purposes only and is not intended as investment advice. Information and analysis above are derived from sources and utilising methods believed to be reliable, but we cannot accept responsibility for any losses you may incur as a result of this analysis. Individuals should consult with their personal financial advisors.
Austin Galt Archive |
© 2005-2022 http://www.MarketOracle.co.uk - The Market Oracle is a FREE Daily Financial Markets Analysis & Forecasting online publication.