


Potential Stocks Bear Market Uptrend Underway
Stock-Markets / Stocks Bear Market Feb 13, 2016 - 11:13 AM GMTBy: Tony_Caldaro

 Another wild week! The market started the week at SPX 1880. After a gap down opening on Monday the market dropped to SPX 1828, but reversed course in the afternoon. By Wednesday it turned slightly positive for the week when hitting SPX 1882. Thursday, however, started off with a gap down opening as the market hit a new downtrend low at SPX 1810. By late Thursday into Friday the market was rallying back up again, and ended the week at SPX 1865. For the week the SPX/DOW were -1.10%, the NDX/NAZ were -0.55%, and the DJ World index was -2.70%. Economic reports for the week were biased negatively again. On the uptick: retail sales, business inventories, GNP, plus the budget and weekly jobless claims improved. On the downtick: wholesale inventories, export/import prices, consumer sentiment, investor sentiment and the WLEI. Next week, after a Monday holiday, we get reports on Industrial production, FOMC minutes, the Housing market and it’s Options expiration.
LONG TERM: bear market
Bear market wave patterns are difficult to anticipate ahead of time. Just like corrections in bull markets, they can unfold in many possible wave forms. Since the most common wave pattern, historically, is a series of a-b-c’s. We always start labeling the first downtrend of a bear market, and the overall bear market structure, using that assumption, while keeping an open mind to other alternatives. In recent years, with the NDX/NAZ playing a bigger part in the overall US equity market, another pattern has emerged.
During the 2000-2002 bear market, while the SPX/DOW were bouncing around in a series of a-b-c’s, the NDX/NAZ completed a very clear 5-3-5 zigzag into the October 2002 low. Then during the 2007-2009 bear market, all four major indices completed a clear 5-3-5 zigzag into the March 2009 low. Since a Cycle wave [2] bear market does not have to alternate in pattern, it is possible this zigzag pattern will appear yet again. Project, monitor and adjust.
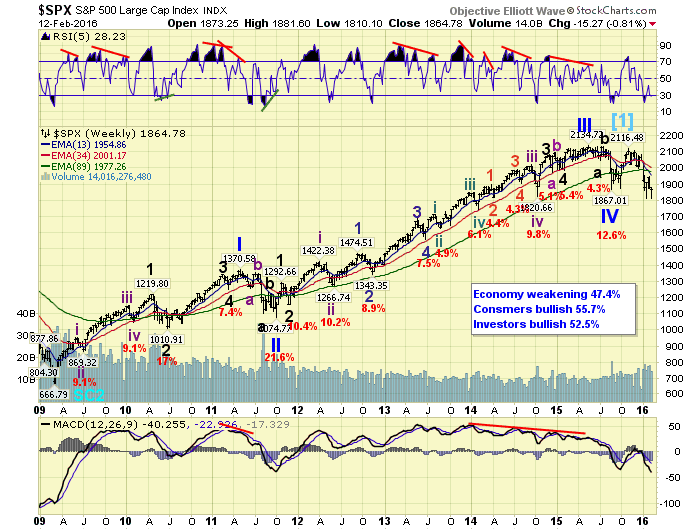
We continue to count the orthodox high of the 2009-2015 bull market as a failed Primary wave V ending at SPX 2116/2104. The actual price high of the bull market ended at SPX 2135. From the secondary high this new bear market has only had one downtrend, which we have tentatively labeled Major wave A. We continue to expect this bear market to last for a year or two while the market loses 45% to 50% of its value. This may appear far fetched, but historically it is quite normal for a Cycle wave bear market.
MEDIUM TERM: downtrend
We had noted last weekend that our tentative Major wave A and B labeling was in jeopardy because of the activity in the NDX/NAZ. After Monday’s decline in the market we updated the SPX daily chart to display a potential five Intermediate waves down from the bull market high. With the NDX/NAZ leading on the downside this pattern looked more appropriate than the count we had been tracking. On Thursday our suspicions were confirmed when the SPX actually made a new downtrend low at 1810, slightly exceeding January’s 1812 low. At this point the five wave downtrend looks quite compelling for Major wave A, as three of the four major indices have indeed made new lows.
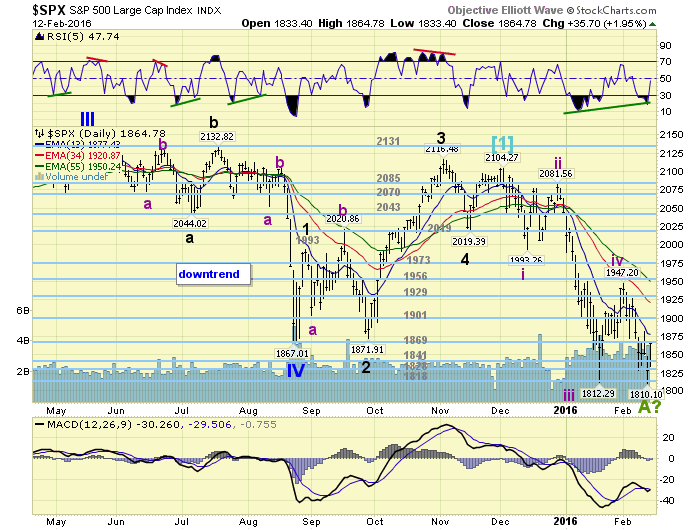
During the downtrend decline none of the three down waves, i.e. Int. i, iii and v, looked at all impulsive using the metrics we had used during the bull market. Naturally, each bull and bear market has its own set of characteristics, as we have noted from time to time. Should the downtrend be complete, as we suspect, we will start to hone into the characteristics of this bear market. However, this will take at least a few trends before the overall bear market pattern starts to take shape. Medium term support is at the 1841 and 1828 pivots, with resistance at the 1869 and 1901 pivots.
SHORT TERM
On Thursday we updated the SPX hourly chart to match the five Intermediate wave down sequence posted on the daily chart. At the same time we posted a tentative Major wave A label at the SPX 1810 low. At that low the market had done the minimum to complete the downtrend, was quite oversold short term, and had positive daily RSI/MACD divergences on the SPX/NDX/NAZ. The DOW had a positive price divergence by failing to make a lower low.
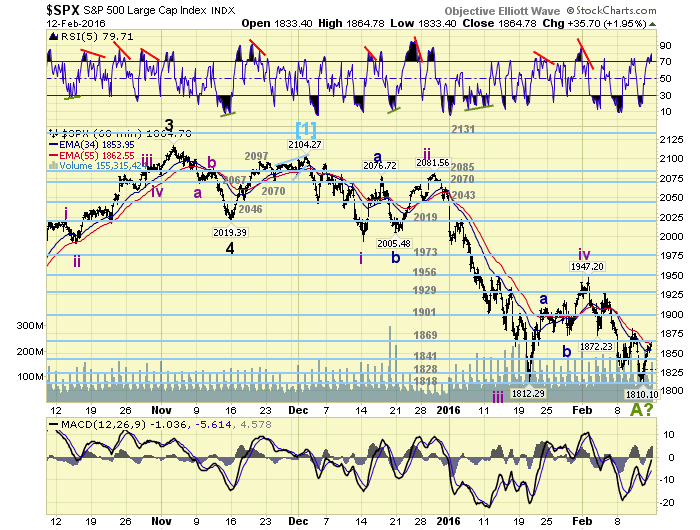
While the declining waves of the downtrend, as noted above, looked choppy. The entire structure displays a short first wave, a very long third wave, then again a short fifth wave. Typical impulsive looking activity. With a potential Major wave A low now in place, a potential Major wave B uptrend can now be anticipated. Normally uptrends during bear markets last from two to four weeks, and retrace from 50% to 61.8% of the preceding downtrend. This would project a rally to between SPX 1963 and SPX 1999 within the next month. Since Int. iv topped at SPX 1947, and Int. i bottomed at SPX 1993 this would create another potential range. Within both of these ranges there are the 1956 and 1973 pivots. With this market having a fondness for the pivots we should start looking for an uptrend high once the 1956 pivot range has been reached.
Short term support is at the 1841 and 1828 pivots, with resistance at the 1869 and 1901 pivots. Short term momentum ended the week quite overbought. Enjoy the three day weekend!
FOREIGN MARKETS
Asian markets were all lower for a net loss of 5.2%.
European markets were also all lower losing 5.0%.
The Commodity equity group were all lower losing 4.6%.
The DJ World index remains in a downtrend and lost 2.7%
COMMODITIES
Bonds continue to uptrend and gained 0.6% on the week.
Crude, despite gaining nearly 8% Friday, lost 5.0% on the week.
Gold continues to uptrend and gained 5.6%.
The USD remains in a downtrend and lost 1.1%.
NEXT WEEK
Monday: holiday. Tuesday: NY FED at 8:30, then the NAHB at 10am. Wednesday: the PPI, Housing starts, Building permits, Industrial production and the FOMC minutes. Thursday: weekly Jobless claims and the Philly FED. Friday: the CPI and Options expiration.
CHARTS: http://stockcharts.com/public/1269446/tenpp
After about 40 years of investing in the markets one learns that the markets are constantly changing, not only in price, but in what drives the markets. In the 1960s, the Nifty Fifty were the leaders of the stock market. In the 1970s, stock selection using Technical Analysis was important, as the market stayed with a trading range for the entire decade. In the 1980s, the market finally broke out of it doldrums, as the DOW broke through 1100 in 1982, and launched the greatest bull market on record.
Sharing is an important aspect of a life. Over 100 people have joined our group, from all walks of life, covering twenty three countries across the globe. It's been the most fun I have ever had in the market. Sharing uncommon knowledge, with investors. In hope of aiding them in finding their financial independence.
Copyright © 2016 Tony Caldaro - All Rights Reserved Disclaimer: The above is a matter of opinion provided for general information purposes only and is not intended as investment advice. Information and analysis above are derived from sources and utilising methods believed to be reliable, but we cannot accept responsibility for any losses you may incur as a result of this analysis. Individuals should consult with their personal financial advisors.
Tony Caldaro Archive |
© 2005-2022 http://www.MarketOracle.co.uk - The Market Oracle is a FREE Daily Financial Markets Analysis & Forecasting online publication.