Stock Market Observations
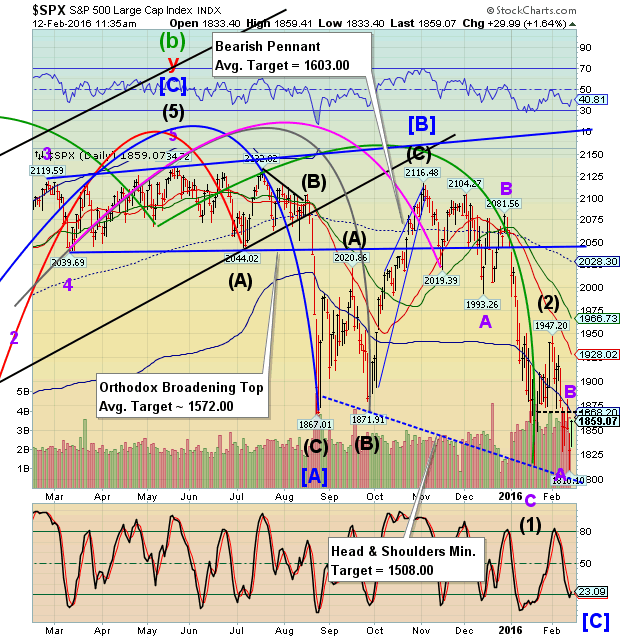
Stock-Markets / Stock Markets 2016 Feb 12, 2016 - 05:23 PM GMT I am showing the larger charts because they display the big picture more clearly. It is now clear that Intermediate Waves (1) through (5) of Primary Wave [C] are A-B-C Waves and not impulsive in the strict sense. We would normally expect to see a clean 5-wave decline in Wave C. This is either a rare variation or an outright aberration. Which is it? I don’t know.
This has Elliott Wavers tied in knots, since an A-B-C move is normally corrective and in this case tells the Elliottician that the next move is a rally! In fact, most analysts would say that today’s decline is a Wave B-with- rally-to-follow. What no one else is watching is the natural resistance at the cycle Bottom at 1868.20 which has been stopping the retracement rallies all week long.

The Cycles have been a great help to me, even though the more casual Cycle followers would call this the positive seasonal Cycle. Some Cycle!
Wave [i] of C has just completed. It has broken the 1812.29 low which sets the stage for a greater decline. Now we wait for Wave 2 to complete.
The issue at hand is time. Today this Cycle will have consumed its normal impulsive decline time of 60.2 hours shortly after 1:00 pm tomorrow. However, it has only complete Waves A & B and [i] of C. The Cycles consist of two parts, time and distance. This leads me to an observation. All of the Cycle bottoms in 2007 and early 2008 were an average 4.3 days early. For example, Wave (C) of [A] was due on March 22, 2008. It bottomed on March 17 instead. However, Wave 1 of (3) of [C] was due on September 15 and fell on September 18. Wave 3 of (3) of [C] was a day late, but Wave 5 of (3) of [C] was due on November 18 and fell on November 22, 2008.
In 2015, The Wave [A] low fell on August 24, but was due on September1, five market days later. Wave (1) of [C] happened to be overdue by a day on January 20. Therefore, it should be no surprise to see Wave (3) of [C} one (or more) market day(s) late next Tuesday (our next Pivot Day, as well). Monday is Presidents’ Day, a market holiday. So time can be stretched in these Cycles. What may affect trading on Tuesday is that China and Japan will be open for a full day’s trading on our Sunday and Monday while Europe will be a day-and-a-half ahead of our markets. That does not position the longs very well if something blows up before the open on Tuesday. There is more commentary on this at the bottom.
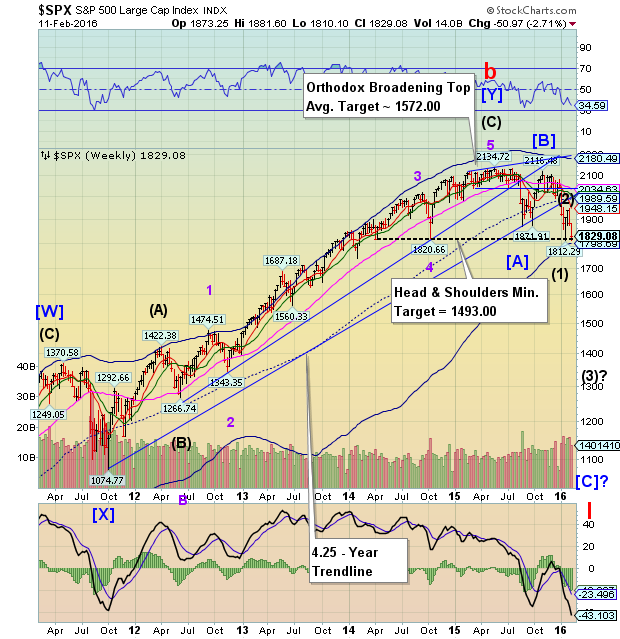
Here is an even bigger picture of where Cycle Wave I may go. The Orthodox Broadening Top and Head & Shoulders formations consistently target the minimum Wave (3) lows. I hope I am wrong for the sake of many friends who are long, but those formations may be conservative in their targeting. In both 1987 and 2008, Wave (3) of [C] was triple the size of Wave (1) of [C]. You can do the math.

That implies a possible catastrophe may happen over the extended weekend. Deutsche Bank, among a few other companies, comes to mind, but there are other accidents waiting to happen out there.
I just don’t think there is an option to go sideways from here.
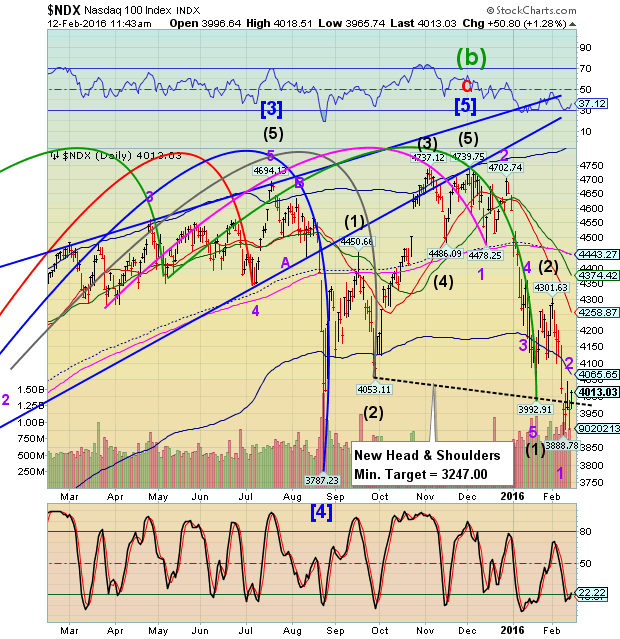
NDX is also attempting to retest its cycle Bottom at 4065.65, but may not succeed. This move may not invalidate the Head & Shoulders formation. Possibly due to the lack of Central Bank interference, the NDX Wave structure appears to be much simpler than that of the SPX.

The issue that I have with the single targeting formation is that, if it sticks to that target, Wave (3) would only be 1.5 times the size of Wave (1). Somehow I can imagine Wave (3) being much larger than that.
Which brings me back to the time issue. Next week is Options Expiration week. Somehow I think that the powers-that-be may wish to see their bearish bets in the options market pay off. After some calculations, it appears that the decline from the Wave (2) high will be exactly 86 hours in length as of the close on Thursday, February 18.
In yet another calculation, the decline from the Wave 2 high may take exactly 43 hours by 11:00 am on Friday, February 19.
That would give more than adequate time for a proper Wave (3) decline. I probably wouldn’t advise testing the second observation since most of you were early to go short and shouldn’t want to extract the last nickel out of the decline. Sir John Templeton once remarked, “I always leave something on the table for the next guy.”
Regards,
Tony
Our Investment Advisor Registration is on the Web
We are in the process of updating our website at www.thepracticalinvestor.com to have more information on our services. Log on and click on Advisor Registration to get more details.
If you are a client or wish to become one, please make an appointment to discuss our investment strategies by calling Connie or Tony at (517) 699-1554, ext 10 or 11. Or e-mail us at tpi@thepracticalinvestor.com .
Anthony M. Cherniawski, President and CIO http://www.thepracticalinvestor.com
As a State Registered Investment Advisor, The Practical Investor (TPI) manages private client investment portfolios using a proprietary investment strategy created by Chief Investment Officer Tony Cherniawski. Throughout 2000-01, when many investors felt the pain of double digit market losses, TPI successfully navigated the choppy investment waters, creating a profit for our private investment clients. With a focus on preserving assets and capitalizing on opportunities, TPI clients benefited greatly from the TPI strategies, allowing them to stay on track with their life goals
Disclaimer: The content in this article is written for educational and informational purposes only. There is no offer or recommendation to buy or sell any security and no information contained here should be interpreted or construed as investment advice. Do you own due diligence as the information in this article is the opinion of Anthony M. Cherniawski and subject to change without notice.
Anthony M. Cherniawski Archive |
© 2005-2022 http://www.MarketOracle.co.uk - The Market Oracle is a FREE Daily Financial Markets Analysis & Forecasting online publication.


