Comparison of Current US Stock Market Performance to that in 2008 and 2000
Stock-Markets / Stock Markets 2016 Feb 10, 2016 - 10:39 AM GMTBy: Submissions
Rajveer Samuel Rawlin writes: A look back at stock market performance in two major bear market years of 2000 & 2008 reveals some interesting findings:
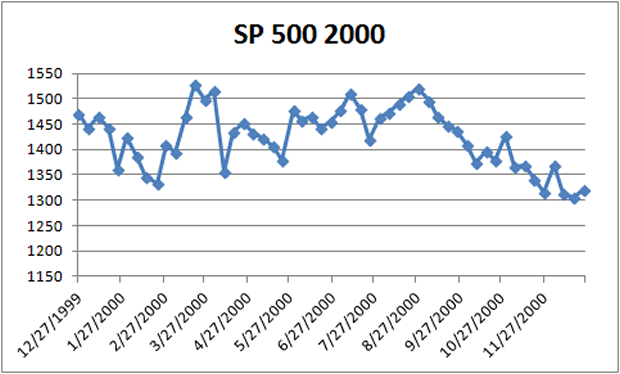
First lets look at the S & P 500 Chart in 2000:

The market dropped 10% to start the year. It proceeded to recover most of its losses by late March failing at prior highs eventually falling over 15% further post August.
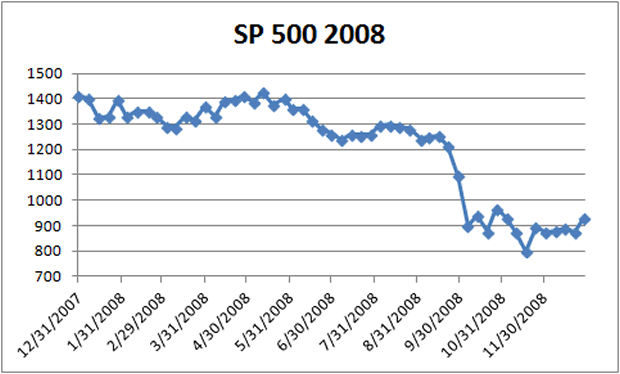
Next lets look at the S & P 500 Chart in 2008:

The market again dropped 10% to start the year. It proceeded to recover most of its losses by early May and then collapsing over 50% into October.
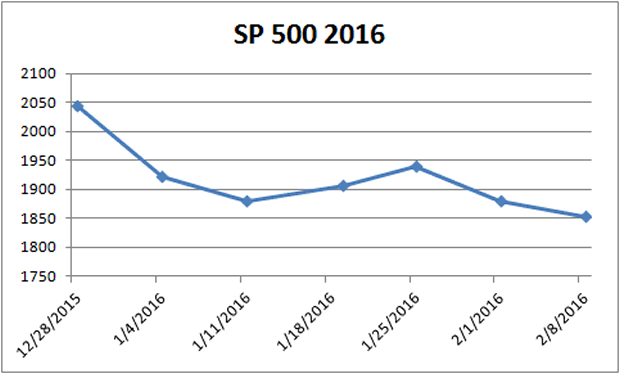
That brings us to Today's market:

We have again dropped 10% to start the year. If we go by what the market did in 2000 and 2008 we should recover most of these losses by May and then begin a major collapse into August and September following an oversold bounce out of the March 2016 lows.
By Rajveer Samuel Rawlin
rajveersmarketviews.blogspot.in
© 2016 Copyright Rajveer Samuel Rawlin - All Rights Reserved
Disclaimer: The above is a matter of opinion provided for general information purposes only and is not intended as investment advice. Information and analysis above are derived from sources and utilising methods believed to be reliable, but we cannot accept responsibility for any losses you may incur as a result of this analysis. Individuals should consult with their personal financial advisors.
© 2005-2022 http://www.MarketOracle.co.uk - The Market Oracle is a FREE Daily Financial Markets Analysis & Forecasting online publication.


