


USDJPY: "Diving" For Opportunity
Currencies / Forex Trading Jan 29, 2016 - 06:08 AM GMTBy: EWI

 Learn how protective stops keep you on the right side the trend
On a recent vacation to the Yucatan, my friend decided to get certified in scuba diving.
I, on the other hand, prefer breathing my air above water! But I did tag along with her to one of the classes, anyway. She learned how to handle and interpret all the various diver gauges: gas pressure, submersive pressure, depth, and on.
The one feature all those indicators had in common was a bold, red line to indicate the level the diver must obey to stay out of danger.
That's when it hit me: Scuba-diving is a lot like financial markets. Investors and traders jump in -- and use an array of safety gauges to keep them on the right side of price action.
Well, at least those investors and traders who use technical market indicators. For them, those bold, red lines indicating the point of danger -- those are equivalent to the most critical component of market analysis: protective stops. The second prices cross this line, it's time to "swim back up to the surface" and safely re-adjust your position.
For any investor/trader, then, the ultimate goal is to clearly identify these life-"lines" ahead of time, before jumping in. That, dear friends, is where our newest, FREE report "How to Set and Manage Stops With the Wave Principle" comes in.
Here is an excerpt:
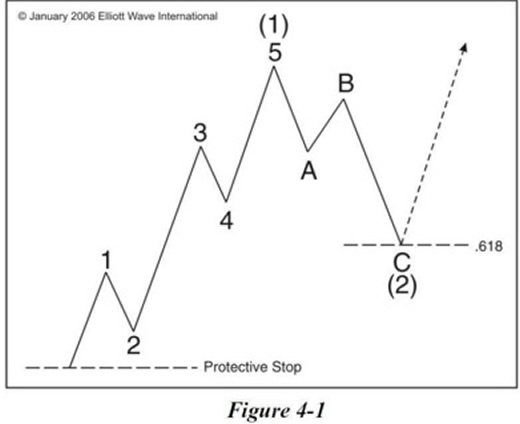
"Let's begin with rule No. 1: Wave two will never retrace more than 100% of wave one.
"In Figure 4-1, we have a five-wave advance followed by a three-wave decline, which we will call waves (1) and (2).
"An important thing to remember about second waves is that they usually retrace more than half of wave one, most often making a .618 Fibonacci retracement of wave one. So in anticipation of a third-wave rally -- which is where prices normally travel the farthest in the shortest amount of time -- you should look to buy at or near the .618 retracement of wave one.
"Where to place the stop: Once a long position is initiated, a protective stop can be placed one tick below the origin of wave (1). If wave two retraces more than 100% of wave one, the move can no longer be labeled wave two."
Okay. Now let's see how this strategy plays out in the recent performance of a real world market: The U.S. dollar/Japanese yen exchange rate (USDJPY). On December 16, our Currency Pro Service intraday analysis posted this update of the popular currency pair:
"The top of wave ((2)) 122.22 and the .618 Fibonacci retracement of wave i 122.27 offers a target zone where this wave ii should run into some resistance. Trading back below the wave (4) low 121.58 will signal ... a wave ii top in place [and] wave iii [is] under way."
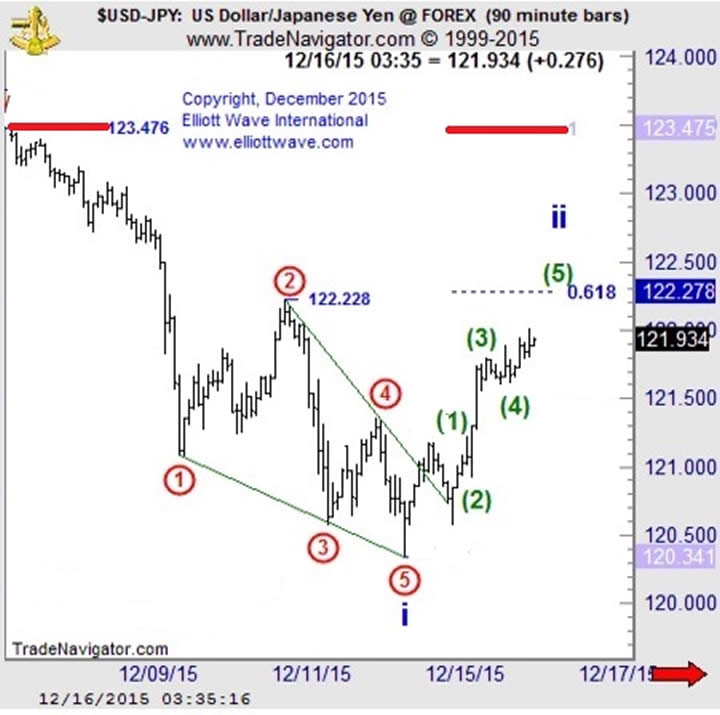
As you can see on the chart above, our Currency Pro Service utilized the Wave Principle's rules for wave 2 price action to identify these two trade-salvaging details:
- A high-probability top at 122.27, the .618 Fibonacci retracement of wave i
- And, while not explicitly stated in the written analysis, the potential protective stop is shown on the chart itself at the 123.476 level, the point at which wave ii would have retraced more than 100% of wave i (red horizontal line at top of chart)
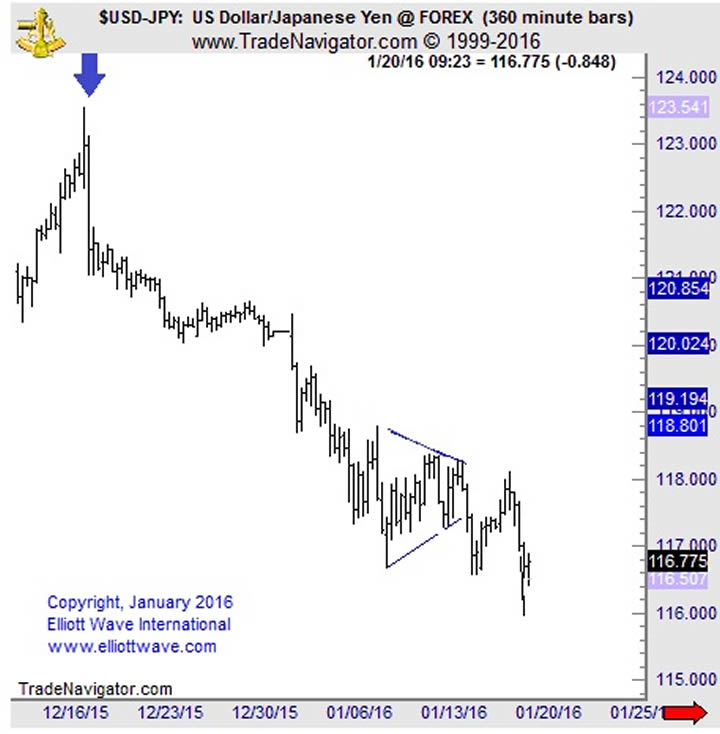
Now, the next chart shows you how the USDJPY did indeed top near the .618 Fibonacci retracement of wave i, turning down in an impulsive turn to a five-month low.
To "dive" in the world's leading financial markets, you need to know how to identify the critical life-"lines" of protective stops.
|
Our FREE report "How to Set and Manage Stops With the Wave Principle" makes this step easy. Or, existing Club EWI members, click here and have the free report on your screen in seconds. |

This article was syndicated by Elliott Wave International and was originally published under the headline USDJPY: "Diving" For Opportunity. EWI is the world's largest market forecasting firm. Its staff of full-time analysts led by Chartered Market Technician Robert Prechter provides 24-hour-a-day market analysis to institutional and private investors around the world.
About the Publisher, Elliott Wave International
Founded in 1979 by Robert R. Prechter Jr., Elliott Wave International (EWI) is the world's largest market forecasting firm. Its staff of full-time analysts provides 24-hour-a-day market analysis to institutional and private investors around the world.
© 2005-2022 http://www.MarketOracle.co.uk - The Market Oracle is a FREE Daily Financial Markets Analysis & Forecasting online publication.